3rd Tuesday 3 For 3!
 Third Tuesday 3 For 3! May 21, 2024 May-November is termed the “seasonally weak” six-month period for the market–with indices up 5.79%-12.13% YTD–NOTING 10% of the Nasdaq’s 12.13% increase YTD happened in the last 30 days– it’s GO TIME for us at Alphavest. It’s essential to consider how this historical bias may impact individual sectors an how sector rotation plays a crucial role in navigating these seasonal fluctuations effectively. We’ve got you managed! Elizabeth Breaden, CIO and I meet multiple times, weekly. For HOURS. Security selection, macro-economics, client allocations and delivering positive client outcomes the topics at hand. Know this; whether your journey at Alphavest began with a goal of excess returns that would enable an early retirement or with a quest for a holistic approach to planning for all seasons of life from divorce to loosing a spouse to exiting your business with our Perfect Day principles–our aim for you remains the same: Continue to add value. The Team recently launched our “10 Words” campaign–we can’t wait to hear from you on your ten words for your “WHY” at Alphavest. We want to know! Stay tuned…In the meanwhile, join for Money & Politics-Let’s talk BOTH! Because if we normalize it, we get better at it! with Julie Hussey, June 5th, 2024 8:30 am, details below!  ? Should bond investors leave the safety of US Treasuries and take on the risk of emerging-market corporate bonds. The “Chief” says….this is a trend across emerging markets and global bonds as we adjust to higher rates, global central bank policy is at a pivot point, and a number of factors continue to play out presumably in favor of higher risk and rates, thus higher spreads. These factors include: 1. Huge investment needs, whether climate or military, and rising interest costs will keep government borrowing high. 2. Demographics is one of the biggest uncertainties facing longer-term rates…the ratio of dependents, including retirees, to workers is rising. That will cause rates to rise as age-related spending cuts saving 3. The physical impacts of climate change also risk bouts of higher inflation, opens new tab and price volatility. But they may shave as much as 17% off global output by 2050. The damage threatens productivity and could push inflation lower, an ECB paper argues. 4. An AI-driven productivity boost may raise U.S. economic growth by 0.4 percentage points and by 0.3 points in other developed economies by 2034, Goldman Sachs expects. It sees upward pressure on rates, especially if AI adoption is frontloaded. 5. The COVID-19 pandemic, wars in Ukraine and Gaza and U.S.-China trade tensions point to higher supply-shock risks ahead. If central banks have to act against them… that can also on average lift the level of interest rates. May 3 for 3: Quitters WIN Are you a quitter? 2 weeks ago one of my favorite Perfect Day devotees quit. “I’m not retiring. I’m quitting,” she said boldly with a smirk and some fervor. And it struck me how often it is with entrepreneurs that they won’t quit; they ride the biz curve up, up, up and then down, down, down. Too afraid of losing one’s identity as a founder or owner or someone having grown an idea into a success and no longer having the trappings—and joys of the day to day to occupy oneself. She QUIT. Quitting means a hard stop. Making a conscious choice to walk. It also embodies future opportunities to do MORE. Right? Ms. Quitter–I’m gonna call her “Blondie”–that’s with a tad of envy from this redhead. You see, Blondie is wise and understands the essence of what Perfect Days are about. YAAAAAAS! The Sine Curve is an interesting metaphor for life cycles and career paths. It represents the natural ebb and flow of successes and challenges that we all experience in our personal lives, careers, and businesses. By understanding where we are on this curve, we can better prepare ourselves to embrace change and seize new opportunities when they arise. Quitting is often seen as a negative term, but it doesn’t have to be. In the context of life cycles and career paths, quitting can actually mean making room for new challenges and goals that will lead us towards greater success and fulfillment. It’s about recognizing when something isn’t working anymore or no longer aligns with our values and aspirations, and having the courage to make a change. As business owners, we need to be adaptable and resilient in order to navigate tough economic times. By embracing the power of quitting and understanding how life cycles work, we can create stronger and more vibrant businesses that are better equipped to weather any storm. This mindset empowers us to help others succeed as well, creating a ripple effect of positive change throughout our communities. A common mistake I’ve seen with owners is ignoring the “Curve” and exiting too late and allowing the business to decline. Owners must be proactive in planning for their eventual exit or transition. By recognizing the sine wave pattern of a business’s life cycle, they can identify growth periods and capitalize on them while also preparing for potential declines. This may involve developing succession plans, grooming future leaders within the organization, or seeking strategic partnerships to ensure long-term stability and growth. To thrive in this fast paced technological era we must be adaptable, forward-thinking, and able to see opportunities for growth from a broader perspective. By embracing the wisdom gained throughout our careers and entrepreneurial journeys and fostering connections with other businesses or mentors, we can navigate the Sine Curve and capitalize on the growth periods while minimizing the impact of decline phases. So let’s celebrate the power of quitting – not as giving up, but as making room for new opportunities! As someone who wants to help others succeed in their personal lives, careers and businesses, I invite you to join me in sharing this perspective with others that are likewise committed to a freedom from uphill struggles in life, and to one of realizing more perfect days, in and out of the workplace. Because we’re not afraid of hills and hard work, we simply need to know what and where the finish line is. Let’s empower each other to embrace the power of quitting and keep pushing forward towards growth and success. Where are you on your Sine Curve? Grab a 15 minute consult here, and let’s decide if it’s time to Quit. Tune in for Episode 2 of Quitters WIN for Blondie’s raw and inspiring journey to QUIT. May Flowers? April’s showers did bring May flowers–what a great start to May, the start to a typically seasonally weak 6 month hike in the market. May brings what is known as the “seasonally weak” six-month period for the market. Last week, we published articles around “market seasonality” and strategies to consider that leverage this historical bias. As we covered, the May to November period has typically provided worse returns over time than the six months from November through April. Even though that effect has been more muted in recent years, the long-term picture remains the same. We could hardly hope to explain this bias, much less the severity over time, but the “strong six months” of the year have accounted for almost all the Dow’s average annual compounded return since 1950. The average return of the Dow during the seasonally strong six months has been better than 7%, while the “other” six months have produced an average return of less than one percent since 1950. From Ian Saunders at Dorsey Wright and Associates: The graphics below illustrate the inventory of 40 Dorsey Wright and Associates equal-weighted sector indices, which have been “live” for the duration of our study period (most have been published since 1998), as well as a handful of benchmarks tracking equity and bond markets. The study includes market data from April 28, 2000, through April 30, 2024, tracking the returns of each index in the seasonal periods (the weak period spans May 1 through October 31, while strong periods span November 1 through April 30 of the following year). The results are displayed in graphs sorted by the “median” return of each index during each seasonal side of the study period, as well as the “min” and “max” returns during the respective periods. We’ve included each graphic along with key observations from each seasonal period. Key Observations – Strong Season (November – April): All 40 sectors and each benchmark ended the last six months in the black. That coincides with all representatives also showing positive median returns during the “strong” seasonal period. The S&P 500 Index SPX rose over 20% in the last six months. Fifteen sectors bested the return of the S&P 500, which is lower than average based on median returns. The Dorsey Wright Building Index DWABUIL posted the highest return at a 43% gain. This sector also shows the second-highest median return during the “strong” seasonal period. All but five NDW sector indices were up double-digits during the seasonally strong period, compared to only 14 sectors showing a double-digit median return during the same annual period. The worst-performing sector index over the past six months was the Dorsey Wright Oil Service Index DWAOILS, which returned just over 4%. Oil Service and Oil stocks tend to underperform the S&P 500 during the “strong” period. 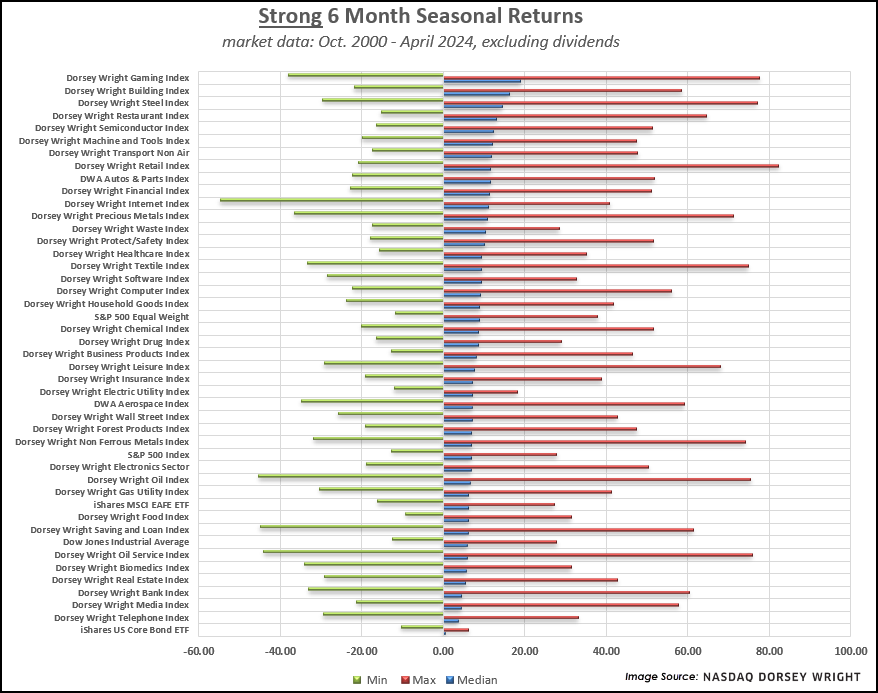 Key Observations – Weak Season (May – October): Performance is typically much more muted for all sectors during the “weak” seasonal period, with no representatives showing double-digit median returns. The Dorsey Wright Software Sector DWASOFT shows the best median returns of all the representatives during the seasonally weak period. Last year, this sector was one of only nine representatives to post a gain during the “weak” season, rising 2.5% over that span. Software stocks have generally underperformed other technology-focused areas in recent months, making it an interesting area to monitor moving forward. The Dorsey Wright Semiconductor Sector DWASEMI shows the lowest median returns of all the representatives during the “weak” season. This area has been one of the market leaders throughout much of the past year but has begun to show signs of weakness over the past month. This seasonality study suggests we could be in store for further turbulence in the space over the next six months.  Market seasonality is simply a historical performance bias that can be seen in examining performance over many years. Keep in mind that there have been several occasions when these trends have not played out. Considering that fact, we would certainly not advocate veering away from areas of market leadership simply because the calendar has changed. The Algebra of Wealth:  The Algebra of Wealth: A Simple Formula for Financial Security MBA professor, Scott Galloway’s take on some simple yet foundational principals of wealth–a very “Perfect Day” meets practical lay-author objectivity. Notable and Quotable: “Diversification is a defensive strategy. But as in sports, defense wins championships.” “If money is the goal, you’ll never have enough.” “Normalize talking about money so you can get good at it.”  Winners & Losers YTD, 30-day Portfolio Winners: While NVIDA may be all the talk, Taiwan Semiconductor/TSM is first AI downstream to win when NVDIA wins…so, its Taiwan Semi for the YTD win in our Alphavest 10 Year High Conviction Model +12.19% YTD.  Our 30 day winner is also in the Semiconductor space, NXPI, from our Alphahvest Aristocrats Model +15.06% YTD  YTD, 30-day Portfolio Losers: MCDonald’s/MCD a holding in our Alphavest Equity Income Model +10.77% YTD has been the biggest detractor of performance, YTD and the last 12 months. With a Mornigstar 4 Star rating (“The firm’s approach strikes us as cogent, and appears to be meeting the evolving needs of today’s restaurant consumer”), and with our belief in higher for longer rates, we feel is a good reason to HOLD yet are monitoring daily.  Nucor Steel/NUE is top of the losers board for the last 30 days, yet with a 1 YR return in excess of 23% the steel stalwart is a HOLD in our Alphavest Equity Income Model +10.77% YTD.  |
| Text OR Call 866-MOALPHA (662-5742) Call Only 843-573-7277 info@alphavest.com |
As always, sending you a Perfect Day,

Advisory Services offered through Red Triangle, LLC DBA Alphavest
PS: Reach out to us to test drive a customized Morningstar Report! AND get your Alphavest Altruist LOGIN for easy to to understand account performance tracking! TEXT US TODAY.
Subscribe to this monthly update.
AND–if you enjoyed this 3 For 3, the greatest thank you is a comment here or forward it to a friend (and you’ll rack up some Alphavest Points!)