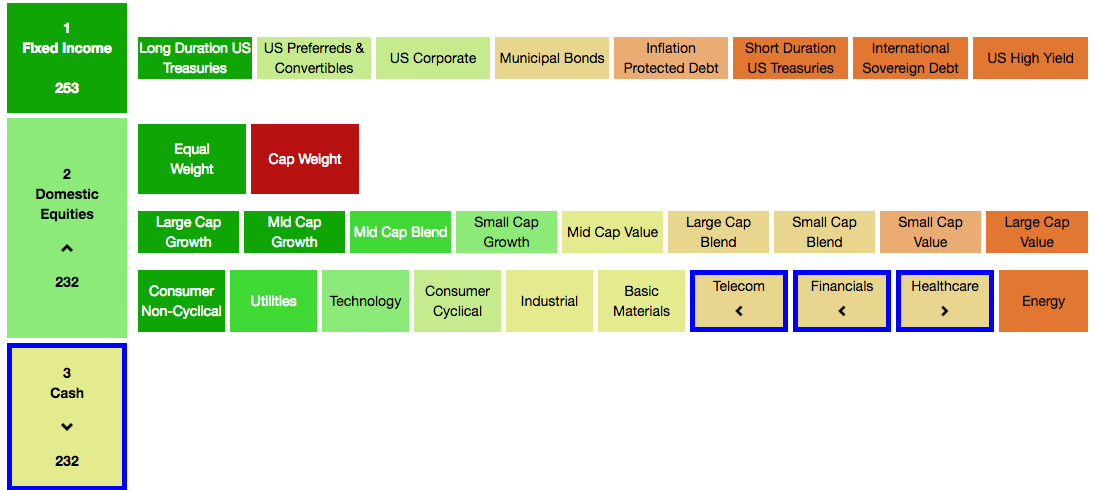
March 23rd we saw meaningful, yet leader-less, change on the Asset Scale: Equities moved up to tie for the #2 spot with Cash. Here’s a detailed and segmented view of the Asset Scale, from Dorsey Wright and Associates, and its sub-sectors.
NOTE: Equities “tally tie” with CASH at 232–don’t worry about the tally details or meaning, just recognize that a tally rank of 232 is a tie for 2nd place, not a fully rooted 2nd place “winning” position for Equities.
Also of note, 1st place tally of 253 is not terribly close to 232, but the gap is getting smaller—down from a previous gap of 30 to now 19 (253-232=19)–this is a good thing if we all agree that reducing bond exposure in a rising interest rate environment is a good thing (YES).

Mid-February when updating investors of stocks sliding to the #3 position, an event not seen since 2011, I illustrated the 2 instances where Bonds and Cash were in the #1 and #2 spots after having dethroned Stocks.
Those dates were the Fall of 2011 and July 2008—the 2011 instance was an unprecedented 19 day head fake on account of the rapid sell off and subsequent rebound due to the US debt being downgraded by Standard & Poor’s for the first time in history. I’ll call this “Door #1.”
The second scenario, “Door #2,” July of 2008–the absolute opposite of a head fake, warned investors of a Recession and a 40% sell off; 2 months in advance. The July reading aided investors who subscribe to a tactical asset allocation approach, and don’t believe that a lazy buy and hold of all asset classes at all times is an effective or prudent investment management strategy.
Thankfully, it appears, as of yesterday’s Asset Scale reading, that head fake wins over recessionary sell-off, for now. For what its worth, I never felt we were leaning toward door # 2, but I didn’t feel door #1 was too realistic either—the 2011 head fake lasted a mere 19 days for equities to make a round trip from position #1 to #3 and back to #1. 2016’s Equity bounce is far from completing the full circle with Equities currently in a tie with Cash for 2nd place, not overtaking Cash for second place. 6 weeks in, and in a tie for 2nd place doesn’t out-do the 19 day round trip we experienced in 2011—and while I hope the equity comeback continues and that my next writing is that of announcing Equities either strongly on 2nd place or better yet, back in first place, in the interim, we will still be judicious–AKA defensive in our equity exposure.
What does defensive mean?
Despite most short and long-term indicators being positive for equities, the Asset Class rank of cash necessitates some cash in the portfolios, despite an equity bounce back. So, for starters, cash equals defense.
Utilities have taken a meaningful position in our portfolios offering nice dividend yields and superior YTD performance with one utility ETF example, RYU up over 12% YTD. We continue to have some exposure to Real Estate Investment Trusts such as ICF, and other REITs which also offer nice yields to buffer your traditional S&P-esque stock volatility. Consumer staples also act as defensive positions, but allow exposure to an equity comeback.
Most of the equity bounce back has been a low quality tech and energy rally as Oil has rallied from its low of $28/barrel in January. Energy stocks, the worst performers of 2015, are now bouncing off of the bottom but offer a lot to be desired at this point in the equity investor game. This bounce, too, has inflated index returns, such as the Dow Jones Industrials and the S&P both considerable energy and tech exposure. And while tech and energy are places that we have exposure to, as we honor risk, again, due to the current state of Asset Scale we will remain under-weight in these spaces until more clear leadership offers a less likely “Door #2” scenario.
David Blitzer, Chairman of the Index Committee S&P Dow Jones Indices offers a reminder many have forgotten; Those who remember the end of the tech stock boom in March 2000… For two or three years, tech stocks led the market up and month by month the tech sector weighting in the S&P 500 climbed from about 15% to a third of the index. But when techs crashed, the entire market was over-weighted in the wrong direction.” Herein lies an example of how indexing can put a dent in a portfolio–and Door #2 in 2008 offered the same with 38% losses for those who decided that owing the S&P 500 was a good idea (many think this today, too).
Investors: be patient and again, judicious. When there is clear leadership on the Asset Scale in support of risk taking measures in equities, then, and only then will it be prudent to own riskier, high beta stocks. In the meanwhile, stay tuned and remember #wevegotyoumanaged.