Let’s face it, very few of us actually go with what Punksatawney Phil sees or doesn’t see.
Well, the S&P 500 Index has enjoyed a strong start to the year after posting a 6% gain for the month of January. With another rate hike and more inflated GDP data, a healthy sell off last week and yesterday, February is still on track for positive further gains across most domestic and international markets. So, don’t always think it has to be this way or another way when it comes to investments.
As I mentioned in this video, while we have a great deal of current positivity—we remain cautious as we anticipate potential further layoffs, more pressure throughout corporate earnings season and future interest rate hikes. Yet, I feel it important to give some ‘substantive legs’ to the recent market rally, both historically and with current technical readings.
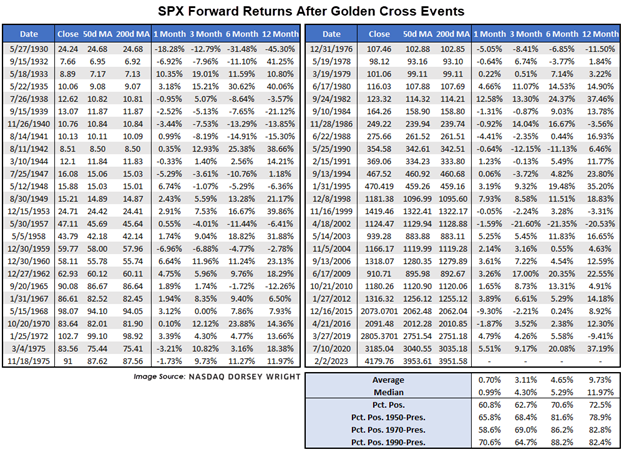
The consistently sharp improvement over the past several weeks also led the S&P 500 to complete the somewhat rare, “Golden Cross,” as the 50-day moving average crossed back above the 200-day moving average based on data through Thursday. This is typically viewed as a positive long-term indicator for the technical posture of the S&P 500 Index. Examining forward returns for the Index from historical Golden Cross events reveals that we do see further improvement more often than not, but the indicator is far from perfect.
This week’s occurrence marks the 52nd time since 1929 that the SPX 50-day moving average has crossed back above the 200-day moving average. The average forward return one month after the 51 prior instances sits at a muted 0.70% with a median return of just under 1%. Those average returns improve as we move 3 to 12 months from each event, with a 9.73% average return after one year. The percentage of positive forward returns sits at 60% one month out and increases to 72.5% on average a year after a Golden Cross. However, it is interesting to note that the percentage of positive returns does increase as we tighten our look back window.

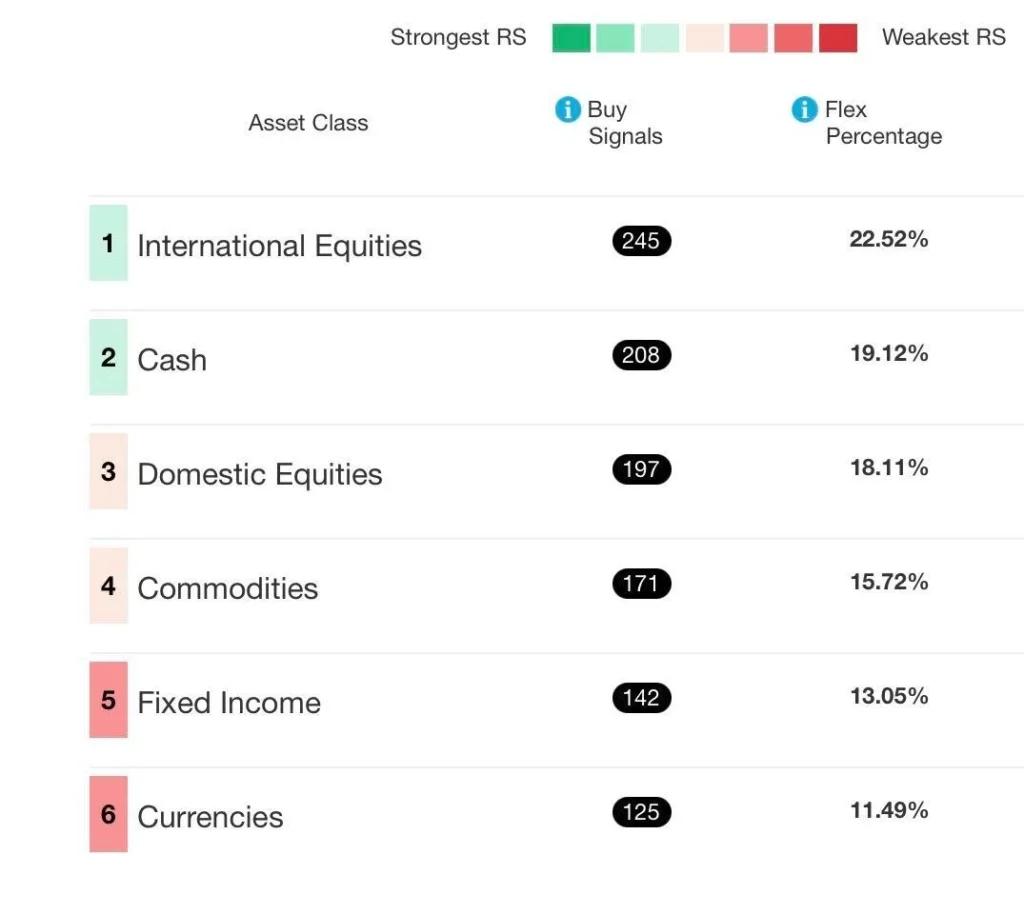
More technical notes to share would be the Relative Strength readings from the Dorsey Wright Asset Scale, seen below.
Note that Domestic Equities has re-joined a top 3 spot with strong footing in the #3 position, with high likelihood of a #2 spot, ousting Cash, soo

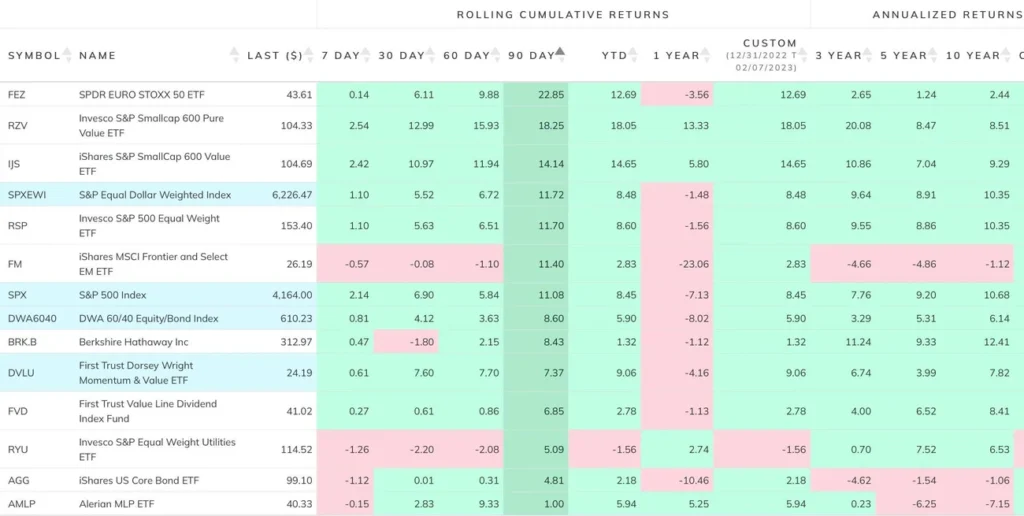
Below you will find a sampling of top holdings in your portfolio, sorted on a 90-day basis to offer a “longer-term” perspective than just the year-to-date strength mentioned earlier.
For ease, pink returns below are negative returns, green are positive.

Note the breadth of positive returns across many asset classes, to include bonds, MLPs, large, small, mid growth and value domestic stocks, and international holdings. Very few assets above have shown weakness on a 7, 30, 60 or 90 basis. Investors who were spooked by Q42022 have missed substantial returns.
Again, we are on alert for the next potential wave–and depending upon whether your allocation calls for buying “more stocks on sale” in your 10-YR bucket or stepping to the sidelines in your 3-YR or your middle “Tactical” bucket, I welcome the opportunity to more precisely integrate your current portfolio, your 3-9 year spending needs, and dial in all of your Buckets. I am committed to customizing a PLAN that resonates with you for a better market experience, today and for years to come. I hope the long video above offers more insight to this further development of the much talked about 3-YR bucket.
Lets connect! Email us today your 3-9 YR bucket needs (3-9 years of anticipated spending from your portfolio), AKA your annual portfolio withdrawal needs, if currently in the withdrawal phase of investing.
Need more info? Grab a 15-minute time slot with Cokie to discuss customization so that we can ensure you are on the right track!
Thank you, as always for your feedback on how we can better communicate with you, and improve your experience navigating markets.

Helen “Cokie” Cox, CFP®
Alphavest, CEO
Wealth Enhancement & Preservation, Managing Partner, Charleston
Two Names, ONE Vision. Putting the “I” back into Investor.