As of 9/1/2015, all major domestic indices turned negative for the year:
2015 YTD, 3 YR & 5 YR Market Stats

The returns for indexes, ETFs, futures, and stocks do not reflect dividends and are based on the last sale for the date requested. Returns for mutual funds do account for distributions. Performance data does not include all transaction costs. Past performance is not indicative of future results. Potential for profits is accompanied by possibility of loss.
Of utmost importance in this blog is to convey to all clients that, no matter what your appetite for risk is, that you ARE invested in cash and bonds—more so than your July portfolio held. Our most aggressive allocations now contain bonds and cash given the current Asset Scale (below).
This is where you are supposed to breathe a sigh of relief and take respite in the fact that we don’t believe in lazy, buy and hold allocations that tell you to ride out storms with unfounded direction.
On the contrary. When an asset class falls below cash, as International equities have, we sell international equities. When Bonds take the #2 Asset Class position, and you are an aggressive investor, alas, you will own bonds. These are the rules. This is GO time.
Remaining disciplined to our time tested strategy of honoring the risk that the Asset Scale presents us, has been easy for 3-4 years—until December of 2014. It got even harder for investors, this August.
Herein lies the perfect example of what defines us as tactical asset managers versus market timers. Why remain in stocks at a correction like this you may ask? Abiding by our time tested rules is the answer. While our tactical methodology and abiding by these rules may not offer out performance in the short-, or even medium-term, we are confident in the long-term results.
More succinctly: We are still invested in stocks because we are still in a Bull Market and Domestic Equities still remain in the #1 position on the Asset Scale. That is why we still own stocks.
Additionally, you own a significant amount more in bonds and cash than was true 7/24/2015 when Bonds slid back into the #2 position and more recently when International equities fell below cash on the scale.
Not sure if you’re in the right allocation? Schedule a call or meeting today!
Below you will find the current Asset Scale line-up, and some repeated commentary from my blog several days ago. Please resubscribe to my INSTANT Blog feed if interested in receiving these updates in a more timely manner.
| Domestic Equities 10/24/2011 1 |
Fixed Income 07/24/2015 2 |
Cash 08/20/2015 3 |
International Equities 08/20/2015 4 |
Currencies 12/11/2014 5 |
Commodities 09/08/2014 6 |
For the first time since March 2009, International Equities has fallen below CASH. As Cash and Fixed Income move their way up the ranks of the Asset Scale, we will remain disciplined and likewise, make your portfolios more defensive as well, with more bonds and cash.
Click here for the remainder of the above Asset Scale update blog post.
From Dorsey Wright on 8/28/15
On the brighter side of things, most stats point to stocks being close to a bottom, if not having already bottomed.
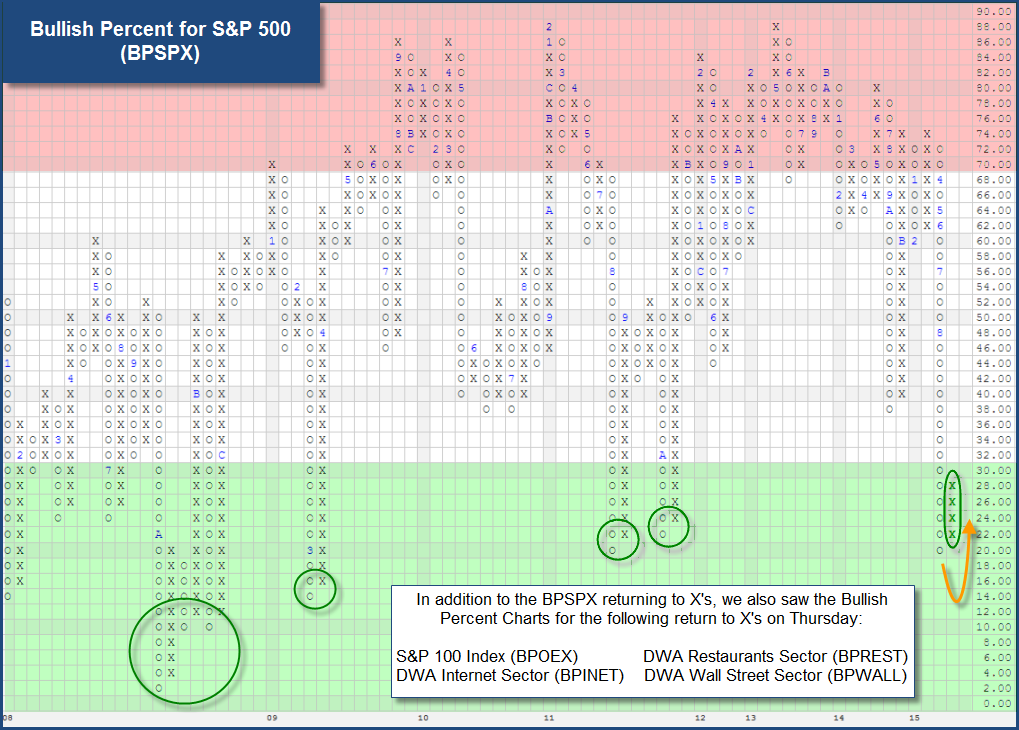
Don’t get too bogged down in the technical aspect of the below excerpt from Dorsey Wright, but focus on the chart and let your head (logic), not your heart (emotion) be your guide:
From Dorsey Wright on 8/28:
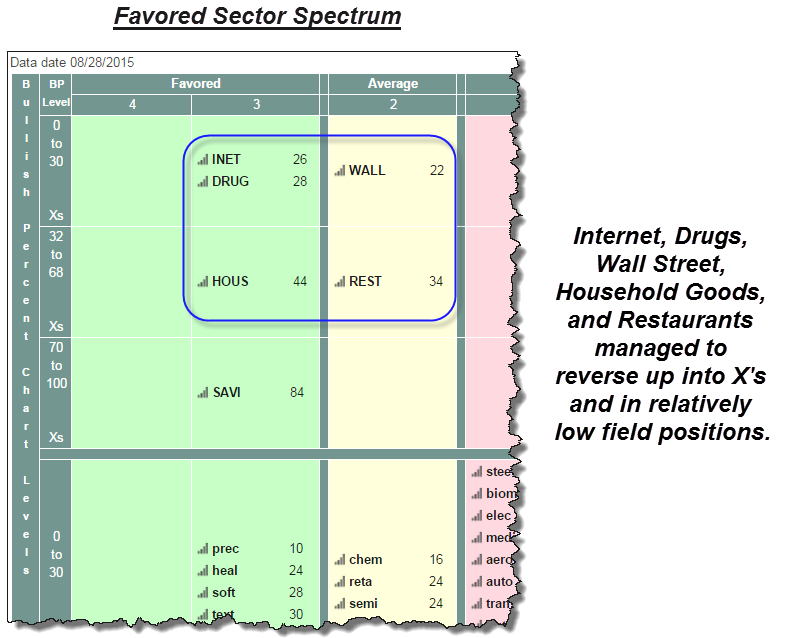
The BPSPX reading fell to a low of 18.80%, meaning that only about 19% of stocks in the S&P 500 maintained buy signals, and the chart down fell to 20%. This was the lowest level the chart had seen since 2009 (the low in 2011 was 18.95%). The chart currently sits around the 28% level, telling us that with respect to S&P 500 names we are back on offense and at a low risk level (green zone). While we have yet to see some of the broader BP charts like the BPNYSE, BPOPTI, or BPALL return to offense, we have seen other smaller universes reverse back up including: BPOEX, BPINET, BPREST, and BPWALL.

Lastly: Since we are invested in stocks—what sectors are we invested in?
Healthcare, technology, wall street, and consumer discretionary stocks.

Subscribe to Cokie’s Blog for more frequent updates on Markets and Matters….
Most of my blogs are less than 200 words – short and sweet!
Not sure if you’re in the right allocation? Schedule a call or meeting today!
It’s times like these that I am blessed to have such a great group of clients—I truly want to make sure you feel the same way. Let’s connect and hunker down for the long-haul.
Thank you for your continued trust and confidence,

Join the Liberated Investor Movement TODAY!
We launched the Liberated Investor Movement in an effort to educate investors on how to break free from being held hostage by “Big Brokerage.”
The Liberated Investor Tool Kit exposes five areas of the investment management industry where the deck is stacked against investors and offers simple and direct advice:
- Excessive Fees and What Can Be Done About Them
- The Myth of Buy and Hold
- The Emotion Behind Market Timing
- Industry Conflicts of Interest
- How to Hire An Advisor That’s On Your Side
Download the Tool Kit today and share with your Facebook community and friends and family!
The best way to refer us? Tell others to download the FREE The Liberated Investor Tool Kit:
