Last week, the S&P 500 dropped 2.17%, the Dow fell 2.19%, and the NASDAQ lost 3.34%.[1] This week is repeating much of the same ‘market sell off’ action. Today, you’ll find most markets were down close to 3%, but snapped back to erase half of the day’s losses, with the Nasdaq almost closing positive. The S&P 500 closed down 22 @ 1859, near 2014 lows.
WHY the downturn?
Persistent lows in oil prices due to the combination of a supply glut and slowing global demand for oil. After plummeting for more than a year, oil prices have now hit 12-year lows below $30/barrel. [2] Cheap oil is a boon to consumers who pay less at the pump, but it hits oil producers and ancillary sectors hard.
A Chinese economy in transition from a manufacturing and export-led high-growth period to a more stable, mature model based on services and domestic consumption. [3] We’ve never seen a hybrid economy quite like it – halfway between Communism and Capitalism – undergo such a shift. The issues at stake are serious: Can Chinese leaders usher in a new period of growth without sending the economy into recession? Can China’s immature financial sector keep up? Answers will come eventually, but we can expect a lot of uncertainty along the way. And in case you haven’t yet heard me say it, markets and uncertainty don’t mix real well.
We should also keep in mind that markets have enjoyed multiple years of fairly reasonable volatility. Since volatility events tend to occur in clusters, it’s not so surprising that we’re seeing back-to-back events in financial markets.[4]
Have stocks hit bottom? We can’t know for sure. This week, we’ll probably see more poor data out of China that could continue to rattle markets.[5] However, it’s possible that earnings season may help turn the tide. While Q4 profits are expected to be down on lower revenues, the bar may already be set so low that earnings surprises could give stocks a boost.[6] When negativity is already baked into stock prices, even small surprises can shift investor sentiment.
For now, however, the Asset Scale continues to be our beacon of risk and guidance to an allocation that has achieved brought major Alpha to ALL Alphavest portfolios, over the last 3 months and more notably, YTD.
Alphavest clients seek to avoid major downturns. While not all downturns are worthy of avoidance (another blog in and of itself!), the Asset Scale, with Bonds in 2nd place and CASH in 3rd place, called this downturn, months ago.
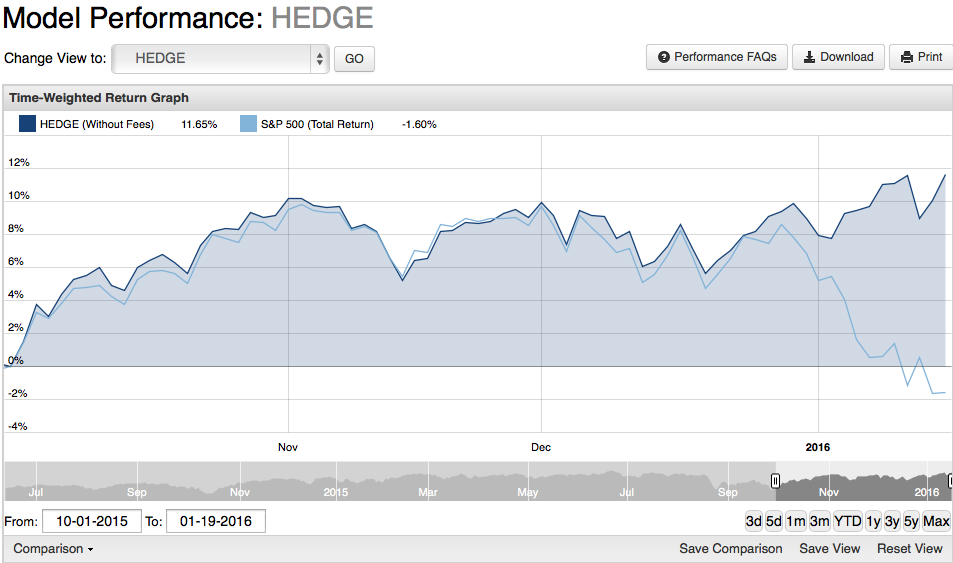
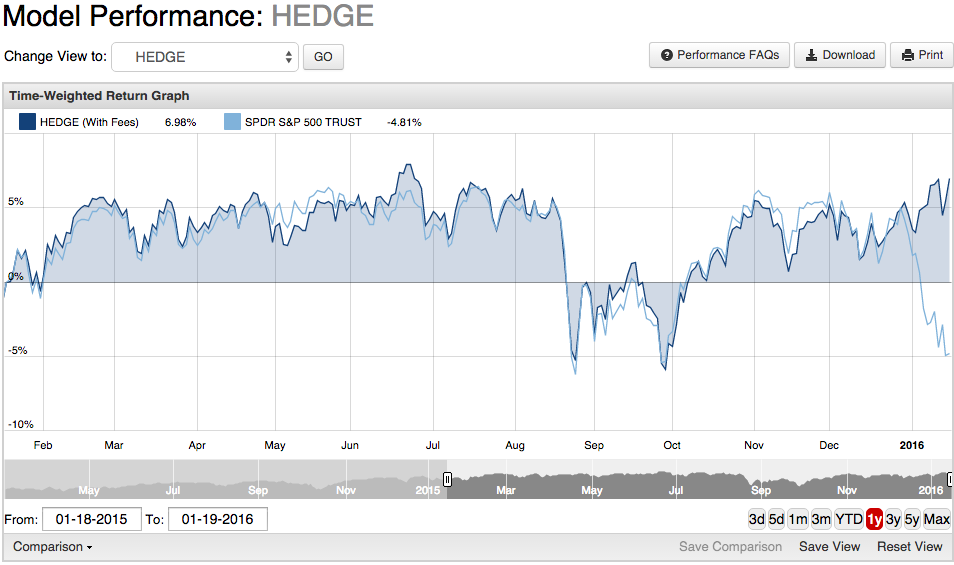
Our Hedge Models are typically where we produce the most Alpha in our portfolios, and are why Alphavest clients are enjoying the evening news more so than their fully-invested-buy-and-hold neighbors.
Year to Date, the last 3 months, and over the last 12 months our Hedge Models have been flexing their market muscles:
Q4-YTD
1 Year:
Bottom line: Market corrections happen. They can be stressful and can test your resolve as an investor, but they are normal and healthy. We don’t know how long this correction will last or how low markets will go, but we are continually monitoring markets and will suggest prudent changes to investing strategies as necessary. If you have questions or concerns about your portfolio, please reach out to us, we’d love to hear from you.
And, oh yeah, remember: We’ve Got You Managed.

