 For those investor-NCAA enthusiasts who aren’t sure about the merits of relative strength as it relates to portfolio success, yet knew better than to pick a #16 seeded team in the office March Madness pool, this blog is for you.
Lets begin with the stats and the NCAA seeding process:
This research from our friends at Dorsey Wright and Associates:
The seeding process of teams began in 1979 as a way for the NCAA to make sure that the strongest teams didn’t end up meeting each other too early in the tournament, which would of course be bad for TV ratings and the overall fan experience. The seeding also provides the uninitiated in basketball a basis for which to make decisions in those recreational office pools. Because let’s be honest, you may or may not love college basketball, but you certainly didn’t take the time to follow the seasons of 64 teams from all over the country. However, we know that picking a number 16 seed, the lowest ranked team in each of 4 regions, to beat a number 1 seed is not statistically a good bet in most pools (i.e. with no point spreads). In fact, there has never been a number 16 seed that beat a number 1 seed in the history of the 64-team tournament. While this is the only seeding combination that is yet to produce an “upset” in over 30 years of tournament action, it is illustrative of a trend, which is that higher seeds generally survive longer in the tournament. A team with a high ranking is, after all, the stronger team based upon qualitative and quantitative evaluation, and they often possess more talent and better coaching than the lower-ranked team they are playing. While past performance has certainly not guaranteed future success for high-seeded teams, it certainly points the average NCAA bracket in the right direction.
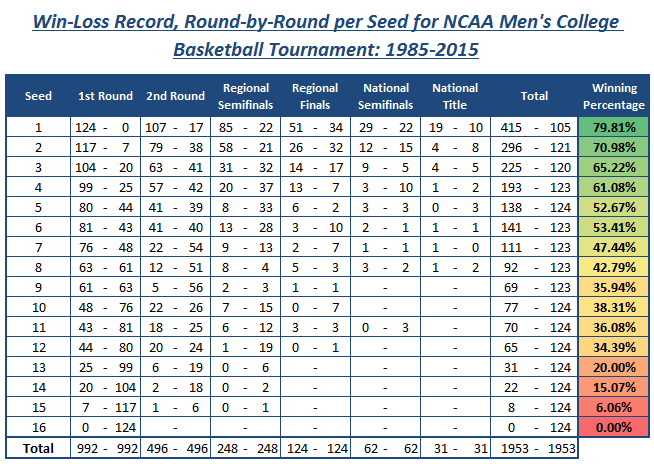
We compiled data from CBS Sports and ESPN regarding the success of each of the 16 seeds advancing through the NCAA tournament, which we have updated to include the 2015 tournament. The seeding process has largely worked out as the NCAA intended them to, with higher ranked teams typically advancing well into the tournament, leading to exciting clashes of talented teams late in the tournament. Top-seeded teams don’t always survive the test to the Final Four, but historically these teams win about 80% of the games they play. A #16 seed has never won a game and the #13 – #16 seeds combine to win roughly 11% of the games they play.

Additional NCAA Seeding Statistics (1985-2014)
- The #1 seeded teams have won the greatest percentage of games at 80% (79.81%).
- The top 3 seeded teams combine for a record of 936 wins and 346 losses, a winning percentage of 73%.
- By contrast, the bottom 3 seeded teams have a combined win total of just 30 games (or 7.46% of their contests) in 31 years of NCAA tourney history.
- The top 5 seeded teams have produced winning percentage of 68%, while the bottom 5 seeds have won roughly 17% of their games.
- Top seeded teams have won more games in tournament history than the bottom 3 seeds have played. (415 to 402).
Is #10 Seeded Syracuse the 2016 Cinderella team?
When the pool circulated the office, all were wondering, “Who is going to be this year’s Cinderella team?” In other words, which of the lower seeded teams are going to defy the odds and and upset a higher ranked team. This is what most NCAA enthusiasts are interested in hearing or talking about, as it represents an outlier, or an improbable situation. The same can be said for “stock picking cocktail talk” when one brags of picking a dog that has surprisingly become a winner. THIS is where the relative strength discussion comes in.
You see, the odds of a #16th seeded team winning could be the same as a 16th seeded stock. Not fully convinced? Well, in 28 out of 31 years, the National title has been won by a team with a #4 seed ranking, or higher!
Cinderella teams exist. #10 seeded Syracuse this year now finds themselves in the Final Four. Last year, we witnessed a couple #14 seeded teams beat teams seeded #3 and a #7 seeded team made it to the Final Four.
The stats offer that #5 seeds still win more than half their games, while #12 seeds win about one-third of theirs but ironically, poolers will spend as much time evaluating which #12 seed will win their first game, versus focusing on which top-seed team will likely win the whole tournament. Are you pickin’ up what I’m putting down as it relates to stocks and relative strength? Focusing on the top stocks versus bottom fishing is a much better use of a stock pickers time.
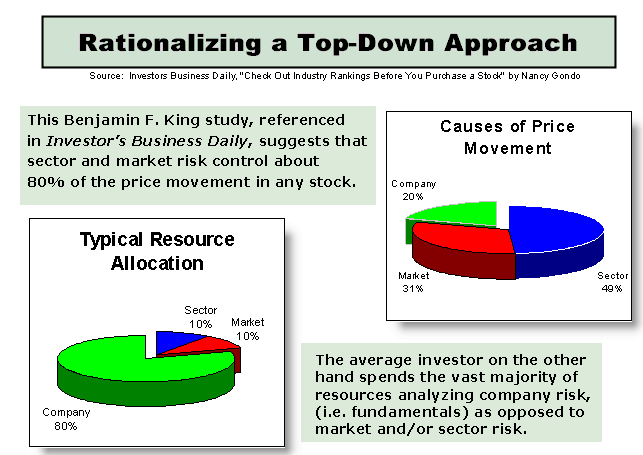
The late great investment guru, Benjamin King conducted a study that looked at the risk in an individual stock and what actually caused the price of the stock to move. The study offers that 80% of the risk in an individual stock is associated with the overall market and the stock’s sector, while ironically, only 20% was company specific; IE deciding to buy the name Apple or Microsoft versus first evaluating if you are in a bull market for stocks (overall market) and that the tech sector (sector performance) is performing? The study also found that the average investor spends 80% of their time evaluating the company specific information; again Apple or Microsoft, and just 20% of their time evaluating market and sector risk — backwards if you want to take on less risk while investing in equities.
So, take that study and apply it to the NCAA tournament and while knowing that the #2 seed has a history of making it much further into the tournament, this means that when you incorrectly pick a #15 (ahem #10 Syracuse, will you be the 2016 outlier!?) seed over a #2 seed, it not only goes down as a loss for that game, but likely a loss of two, three, or more games in your office pool’s bracket. Basically, you took on more risk than was necessary — did you spend 80% of your time analyzing the bottom seeds versus the top seeds?
So, while the allure of being able to claim “victory” in picking a #15 seed over a #2 seed might seem alluring, the fact is such picks have been correct just 6% of the time in NCAA Tournament history. Which side would you truly rather be on? And so it is true with stock picking.
The NCAA tournament is a perfect analogy to use in describing the use of Relative Strength in portfolio construction. Just as a basketball team has a rank, so does a stock, mutual fund or exchange traded fund (ETF). Ranked by pure performance and not what the television announcer or CNBC says, these investment vehicles, too, are “seeded.” There are upsets, of course, but the trend favors the higher seeds and so that is where we focus our investment brackets.
Let’s Seed the Dow:
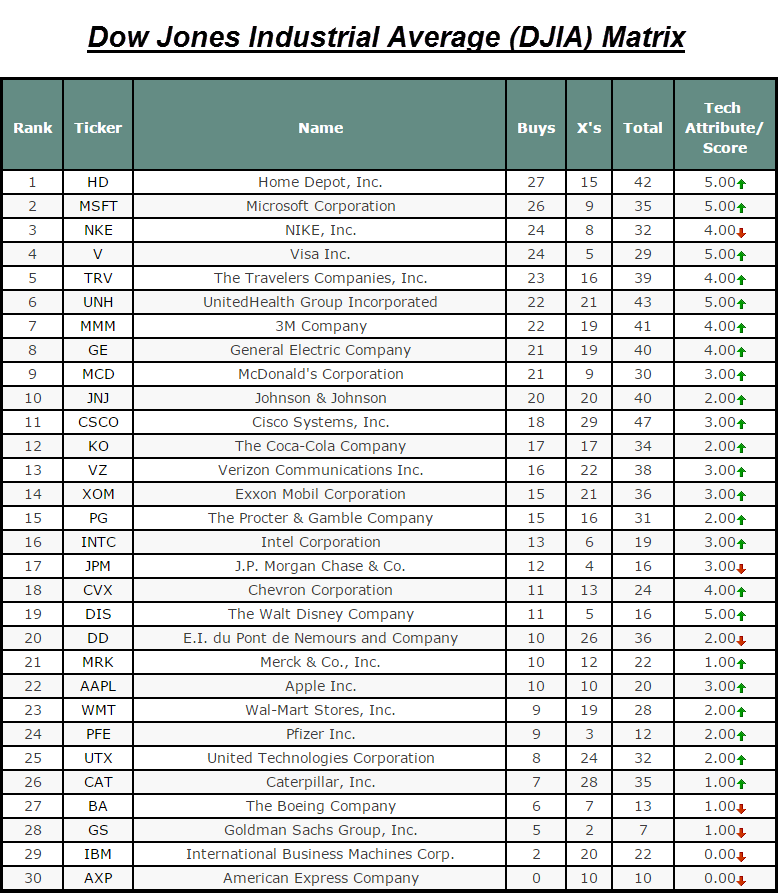
Below shows a relative strength matrix ranking of the Dow Jones Industrial Average DJIA provided by Dorsey Wright and Associates.
“The below is an objective ranking of the 30 stocks that will make up the new DJIA. While RS Matrix rankings can be done for any combination of stocks, ETFs, mutual funds, or commodities, the matrix ranking below displays the ranking of the DJIA stocks from strongest to weakest after they have been compared on a relative strength basis. Said another way, Home Depot, Inc. HD is the top “seeded” stock within the DJIA, while Microsoft Corporation MSFT is the second “seeded” stock, etc. On the other end, the lowest seeded stocks are American Express Company AXP and then International Business Machines Corp. IBM. Thus, the focus of our investment portfolio should be upon the more stable trends, which are identified by high “seedings” within an RS matrix ranking and not the weak ones, ie: the lowest seeded stocks. As you can see, this is why relative strength and relative strength based tools, like the RS Matrix, are useful because they give us a simple, elegant way to objectively rank and seed assets, helping us to effectively identify the strongest and weakest areas of a given investable universe.”

![]()