Familiar with our mantra, “Emotion is out, Logic is in?”
While I recognize its easier said than done—it still remains that removing emotion from your investment portfolio is numero uno to becoming a Liberated Investor.
Here’s an indicator we use that will give you a leg up on removing the emotion, today; the overbought/oversold (OBOS) reading on the S&P 500 Index.
Tomorrow may hold more surprises, but the stats on this mother of indicators, will remain attractive, in very oversold territory, for at least a day or two (some levity with the extreme volatility in markets).
“Yesterday we saw the
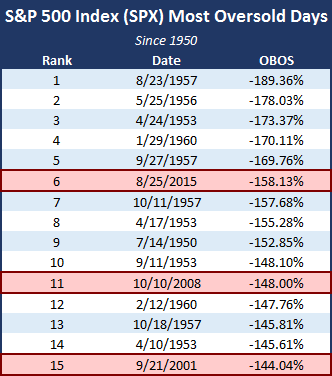
weekly distribution reading for the S&P 500 Index [SPX] fall to -158.13% indicating that the market is in an extremely oversold state. Weekly distribution tells you the overbought/oversold (OBOS) reading of a stock, fund, index, etc., and it can range from more than +100% to less than -100%.
A positive number indicates that the chart is in an overbought condition while a negative number means that the chart is oversold. A reading of 0% means that the chart is perfectly normal, neither overbought nor oversold. The number is calculated based on its ten-week trading band, and the top of its trading band equates to 100% overbought while the bottom of its trading band is 100% oversold.
Let’s take a look at other dramatically low weekly distributio n ratings to put yesterday in perspective.
Beginning in 1928, there have been 162 days when the S&P 500 was oversold by more than 100% (i.e. weekly distribution less than -100%).
If we look at data since 1950, we see that August 15th, 2015 was the 6th lowest reading. During the market correction in 2014, the S&P 500 reached a weekly distribution low of -73.52% on October 17th, 2014, and in 2011, the lowest day was August 19th, 2011 at -95.09%. These days rank as the 335th and 185th lowest readings, respectively.
The table above summarizes the fifteen lowest weekly distribution (most oversold) days for the S&P 500 since 1950 and highlights recent dates in red.
The S&P 500 Index was not the only oversold index yesterday as both the S&P 400 Mid Cap Index
[MID] and the S&P 600 Small Cap Index
[SML] experienced similarly low levels of -159% and -145%, respectively. For those who subscribe to mean reversion as we do, extremely low levels like this suggest potential to the upside.”
From DWA Daily Equity Report – Last edited Wed, Aug 26, 2015 21:02Be a different investor—BE a Liberated Investor; one who who embraces logic and shuns emotion. Hunker down and weed out the facts from the opinions.
Tune in for more ways to remove the emotion and take opportunity in this blip in market history.
Contact us if you have any questions–or need a dose of Liberated Investing. Just remember: We’ve got you managed.
As always, thank you for your feedback as we try to keep you updated on the market and your investment portfolios.


