 WEEKLY UPDATE – August 8, 2016
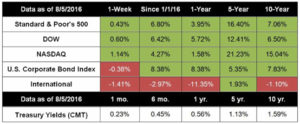
Stocks bounced last week, ending sharply higher after a better-than-expected jobs report. For the week, the S&P 500 gained 0.43%, the Dow rose 0.60%, the NASDAQ added 1.14%, but the MSCI EAFE lost 1.41%.[1]
Among last week’s major events was a shockingly good July jobs report. Last month, the economy added 255,000 new jobs, blowing away expectations of 180,000 jobs.[2] Even better, the gains were broad-based and the labor force participation rate (an area of concern because fewer people in our population were actively participating in the labor force) ticked upward.[3] Overall, not too shabby.
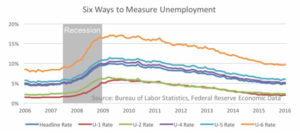
Headline unemployment remained stable at 4.9%, but that single number hides a lot of complexity. Let’s dig a little deeper. The chart below shows six different measures of unemployment, each slicing the data in a different way.

The U-6 unemployment rate is the most comprehensive, showing total unemployed, marginally attached workers (discouraged workers and those considered barely employed) and those total employed part time for economic reasons.[4]
You can see that all measures rose during the recession and have been steadily dropping ever since. While headline unemployment (U-3 unemployment in official parlance) stands at 4.9%, U-6 is still at 9.7% (almost two percentage points higher than the pre-recession low of 7.9% achieved in 2006), indicating there are many people who haven’t participated fully in the labor market recovery; however, the rate has fallen significantly from the 17.1% high it reached in 2009. All told, most areas of the labor market are still making gains.
Britain’s central bank moved to lower interest rates to fight the Brexit blues. The Bank of England cut interest rates for the first time in nearly seven years and announced an aggressive round of bond purchases to stimulate economic activity.[5] The bank is moving quickly to head off a possible economic blowback from Britain’s vote to exit the European Union.
Will the Federal Reserve raise rates while one of our major trading partners is going the other way? We’ll see.
ECONOMIC CALENDAR:
Tuesday: Productivity and Costs
Wednesday: JOLTS, EIA Petroleum Status Report, Treasury Budget
Thursday: Jobless Claims, Import and Export Prices
Friday: Retail Sales, PPI-FD, Business Inventories, Consumer Sentiment

Notes: All index returns exclude reinvested dividends, and the 5-year and 10-year returns are annualized. Sources: Yahoo! Finance, S&P Dow Jones Indices, and Treasury.gov. International performance is represented by the MSCI EAFE Index. Corporate bond performance is represented by the SPUSCIG. Past performance is no guarantee of future results. Indices are unmanaged and cannot be invested into directly.
HEADLINES:
Motor vehicle sales miss expectations. July sales of cars and trucks by major U.S. automakers slipped as pent-up demand slackened.[6]
Consumer spending increases more than expected. Spending by American consumers rose more than expected in June, suggesting consumption remained strong throughout the second quarter.[7]
Factory orders fall. New orders for manufactured goods fell in June for the second month in a row, though stabilizing business spending offers some hope.[8]
Construction spending falls to one-year low. Spending on construction projects fell in June, suggesting a downward revision to second-quarter economic growth may come.[9]
#WeveGotYouManaged
Sources: