
THIS WEEK IN REVIEW
Headwinds: From Hamas to “Higher for longer” . . . and a dose of Triskaidekaphobia (I think you’ll want to watch the video.)
This week we saw markets higher across the board, from 1.5-3.13% on the board equity market indices to even a positive reading of +.13% for the Core Bond Index. Yet, uncertainty persists; and the uncertainty level is even higher than it was 6 months ago.
The headwinds are real, from Hamas to a “higher for longer” sentiment on interest rates with a dose of widespread political unrest — it is clear that markets have many reasons for greater volatility. Kind of like a busy highway under construction, right? Lots of danger and lots of noisy distractions that may or may not be of consequence.
Let’s “talk” red, yellow, green — a new perspective on market happenings. Whether you agree or disagree on inflation, interest rates, hard or soft loading recession — all agree the light is YELLOW — NOT Green. Some may say RED, but very few. So what is this red, yellow green all about?
Here’s my analogy from a talk I sat in on this week with Chief Market Strategist, Troy Gayeski of the $75B Global Alternative titan, FS Investments. Allocating your portfolio and the risk you assume today is a bit like approaching a stoplight on a busy highway with construction, school buses, and a Kamala Harris motorcade – THAT happened Wednesday.
The light changes from green to yellow . . . most slow down knowing there’s a red light coming. Some people would speed up and run the light. Where are you on your journey? Are you driving cross-country with 30 hours ahead and no need to rush? Alternatively, are you late for an important meeting one-mile away?
In either scenario, running a yellow light can potentially get you where you’re going, faster — along with increased risk of death, or delay by a speeding ticket or otherwise. You get where I am going? If you’re retired and in an active withdrawal phase with your investment portfolio, don’t run any yellow lights. Yellow=caution, slow down.
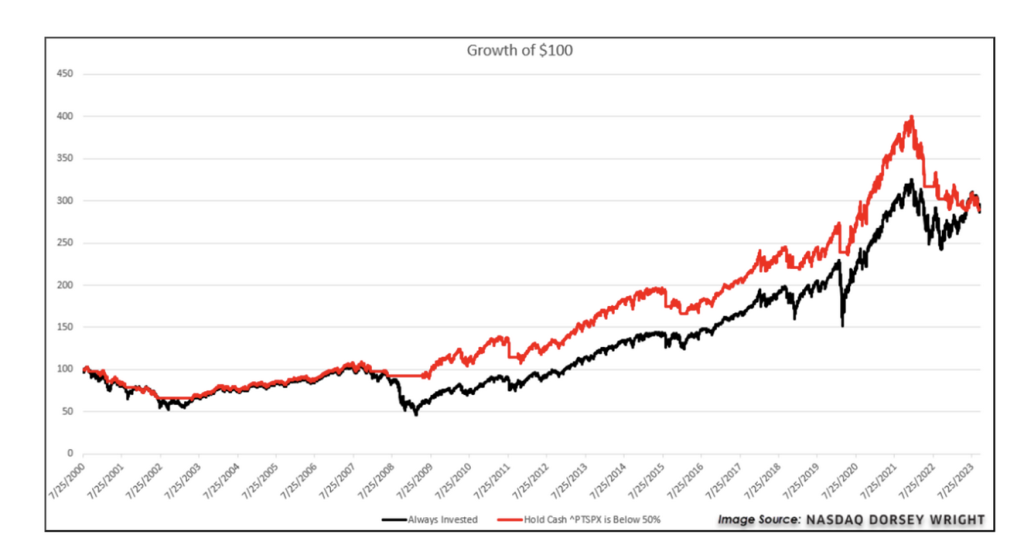
The risk is too high–crashing and burning. Listen to the caution signs of many headwinds, including, what I think is the most consequential of headwinds–higher than normal rates–and as of this week, the Percent of Positive Trend dropping below 50%. Huh? The Percent of Positive Trend indicator is just one of the key indicators that guide our “stop light” color guidance, or, our temperature reading for risk in the market.
See chart below to see a 20+ year history that evidences the credence of heeding to this indicator; NOTE; see RED straight lines in chart below during the rough markets during years 2008-2009, in particular…and how helpful the indicator was in guiding one to a more stable allocation–no equities—during this period. And, again–on a 23 year look-back, the indicator has returned the same as a buy and hold/S&P 500 strategy, yet with much less volatility (ahem, less risk) and….a lot less heartburn.
So, in short: Are you age 35 to 45 and saving for retirement? You can afford to decide if the light is slightly more green than yellow. That’s great news! If not, and you’re retired and in an active withdrawal strategy, it may be time to head the caution light.
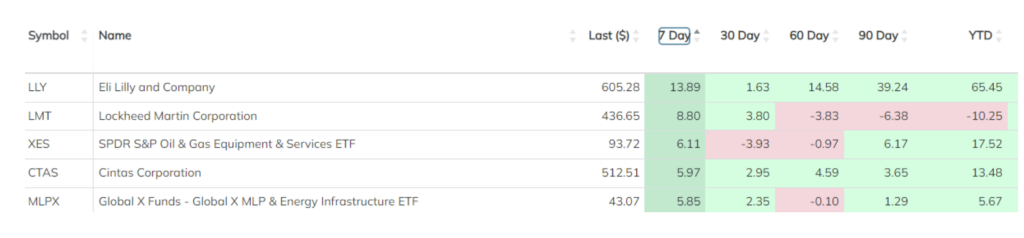
WINNERS
Oil!
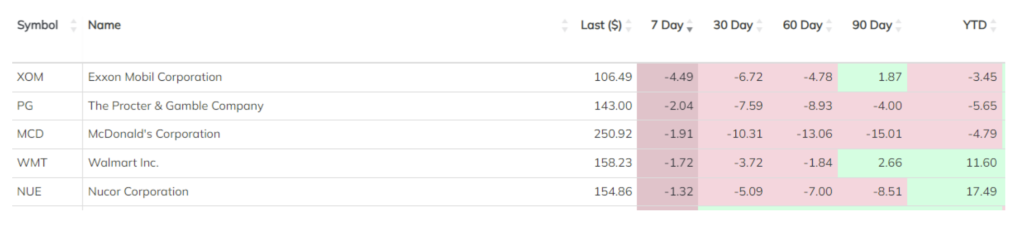
LOSERS
Stable, secure high dividend paying blue chips. SIT TIGHT!
Subscribe to this weekly update. AND–thanks for your comments and feedback on what you’d like to hear about NEXT WEEK.
As always, sending you all . . . a Perfect Day,

Advisory Services offered through
Red Triangle, LLC DBA Alphavest.