When you consider the anatomy of a market correction, as defined as a decline of 10% or more, what truly contributes to a correction and what is just noise?
Let’s start with a simple stock market mantra: All markets exhale.
Followed by an analogy: If you’re running a marathon, and I assume your investing career is a long-term one, and not a 50-yard dash, and you decide to stop at mile marker 16 for a water break – are you going to throw in the towel and quit because now you’ve just slowed down your finish time?
Absolutely not.
Indeed, you tell yourself, that BECAUSE of the water break and, yes, a slowing of your overall time, you’re going to finish and better, you’ll finish strong (hydrated!). The market needed, and has taken a WELL DESERVED, water break.
Now, it’s up to savvy investors to take advantage of the hydration infusion, finish strong, and aschew the pervasive noise on the “street.”
DEFLATION:
Are fears of deflation and/or the polar opposite, inflation, contributors to this or any correction? Maybe.
The truth is, though, if fears of deflation are founded, and I suggest they aren’t in the US, but Europe, perhaps – then, we’re looking at more than a 10% correction in our future. If deflation happens we’ll be faced with a long-term structural Bear Market – not a 10% decline.
The last true deflationary period we experienced was during the Great Depression. So get a grip, 1928 this is NOT – our GDP is currently expanding, not contracting.
Will a much talked about European deflation be tragic? Japan has been experiencing deflation since the 90’s – we seem to be handling this just fine with US market gains north of 425% since then.
Let’s say it’s easy to count this as NOISE.
INFLATION:
Inflation, thanks to the presence of Quantitative Easing, whereby the Fed has reduced its bond buying to a mere $15B per month from $85B back in December 2012, is a possible and likely scenario.
Does inflation contribute to market corrections? Again, maybe.
I would suggest it’s the fear of inflation that causes markets to correct, however. From here, a valuable lesson in the stock market being a leading indicator, is prudent.
Charles Schwab’s Liz Ann Sonders explains this phenomenon best in her 2013 article about the “Economy Disconnect.” Sonders explains my aforementioned leading indicator comment best:
“More often than not, poor economic growth corresponds with a trough in the market. Super-heated economic growth is usually a sign that someone is about to take away the punch bowl. In truth, there is really no disconnect if you accept that the stock market usually leads the economy.”
As Ms. Sonders points out, the S&P 500 is part of the Index of Leading Indicators. A lot of investors have trouble wrapping their heads around that concept – and it continues to cost them money.
Note the below illustration and the opposite directions of GDP growth and stock market returns;
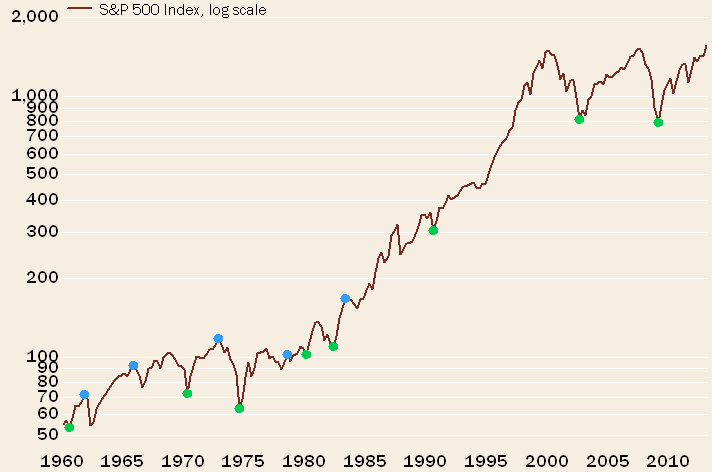
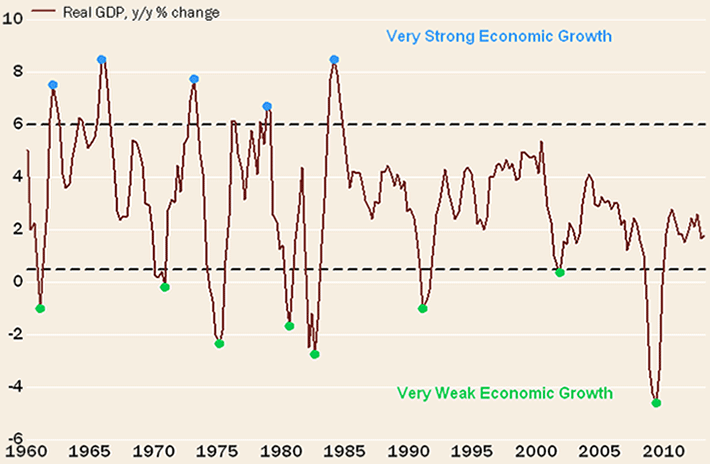
Source: Charles Schwab & Co.
You see, economic events such as inflation or deflation aren’t what cause market corrections – it’s the fear of them that causes markets to correct, and as the above shows, in advance, of the actual “event.”
Either way, the biggest lesson to learn from corrections is that they are corrections – not Recessions. The 2008 Recession is still so fresh in investors minds…and rightfully so.
Market corrections are simply evidence of sound bites in the media, preceded by terrific bull market returns.
And, by the way, happen, on average, every year. In fact, since 1928, the S&P 500 has pulled back 10% 93 times over an 86 year time frame. Interestingly, the last true correction was in 2011 when the S&P 500 pulled back a little over 19% from 4/29/2011-10/3-2011.
So, with 3 years without a 10% correction may explain why this recent market pullback has felt a bit worse than the numbers might suggest. By way of perspective, the S&P 500 has corrected 7.4% from its highest close on 9/18/2014.
This from Dorsey Wright & Associates:
“By historical averages, the market is certainly “due” for a 10% correction; however, there is precedent of the market to go prolonged period of time between 10% pullbacks. For instance, it took 4 ½ years from the bottom in March 2003 to November 2007 between 10% corrections…and that was during a structural bear market. Looking back into the last structural bull market from the early ‘80’s through the end of 1999, the S&P 500 went roughly seven years between 10% pull backs from August 1990 to October 1997. In order for the market to hit a 10% pullback, we would need to see a closing value for the S&P 500 of 1810.22.”
The S&P 500 currently sits at 1862.
The bottom line? Analyze the risk on the field to guide your investing decisions in times of corrections – remembering that, 95% of corrections are just that – corrections, and NOT Recessions.
From where I sit, the view is nice and the water is warm. The risk is much lower than it was in July, when 70% of all NYSE stocks were on a buy signal. That reading is now 34%. Time to take opportunity with quality names, in outperforming sectors, based on cold hard data, not fear and noise.
This is the way of the Liberated Investor™. Calm, confident, logical investment decisions – that’s no noise, but food for thought.