
The fourth quarter and 2021 are now officially in the books. After a rocky end to the third quarter, US equities quickly rebounded in October. Aided by generally strong earnings reports, the S&P 500 and Nasdaq each gained around 7% for the month, with the Dow posting a gain of nearly 6%.
US equities’ strength carried through into November with the S&P 500 reaching new all-time highs. However, the emergence of the omicron COVID-19 variant and concerns about the efficacy of existing vaccines sent stock prices and bond yields tumbling post-Thanksgiving.
While the emergence of the omicron variant pushed stocks lower, it took a larger toll on oil prices, which declined more than 10% the day after Thanksgiving, the largest one-day decline since April 2020, leading to a loss of more than 20% for the month.
In remarks the following week, Fed Chair Powell struck a more hawkish tone further unnerving equity investors. Powell said that it was no longer appropriate to call inflation “transitory” and, citing the strength of the US economy, said that a faster tapering of asset purchases was under consideration, The S&P 500 finished the month down slightly, posting a loss of -0.83%. Small-cap stocks were hit harder as the Russell 2000 lost nearly 4.3%.
Fears about the omicron COVID-19 variant subsided as data indicated that, while more infectious, the illness caused by omicron was less severe than other variants, and the S&P 500 ended December with a gain of more than 4% for the month.
Crude oil also rebounded as worries about omicron eased, gaining nearly 14% in December to finish 2021 up more than 55%, its best year since 2009.
The S&P 500 ended 2021 with a gain of just under 27%, its second-best annual return since 2013. Meanwhile, the Nasdaq and the Dow gained around 21% and 19%, respectively. This marked just the sixth year in which the S&P 500 outperformed both of the other major US benchmarks.
While 2021 was undoubtedly a positive year for US equities, rising interest rates were a headwind for bonds. The Bloomberg Barclays US Aggregate Bond Index was down about 1.7% in 2021, its worst year since 2013.
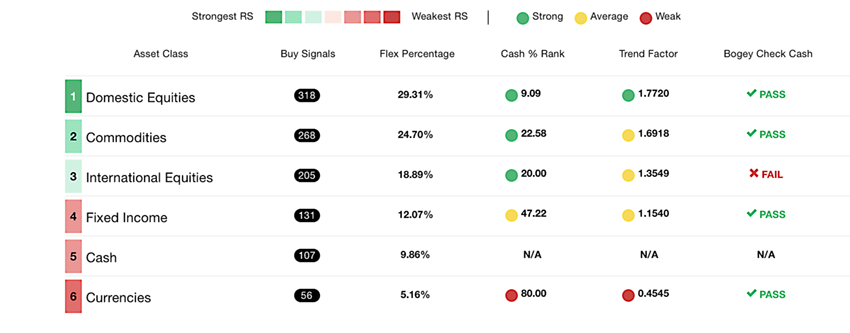
As we begin 2022, we continue to monitor closely for any shifts in the market landscape. Most clients understand and subscribe to a metric often used by us at Alphavest that refers to an “Asset Scale.” A ranking of the top traded asset classes, ranked by their relative strength group visa via one another, based on a basket of widely held securities in each particular asset class.
The current Asset Class line-up ranks Domestic equities and commodities remaining in first and second place, respectively. This Asset Scale provides us with a heat map of where relative strength (and weakness) resides across and within asset classes. From a sector perspective, relative strength resides with technology and financials; the technology sector regained the top spot in the sector rankings late in the year, finishing 2021 in the same position in which it began.