The most material development YTD is the unfortunate move of Commodities back into the #2 spot on the Asset Scale line-up. You may recall that Commodities wreaked havoc on markets last year as they dominated the returns space for 69% of trading days in 2022. Not a great (ahem–quite volatile!) landscape for investing, say retirement dollars. And, such is true again, today.
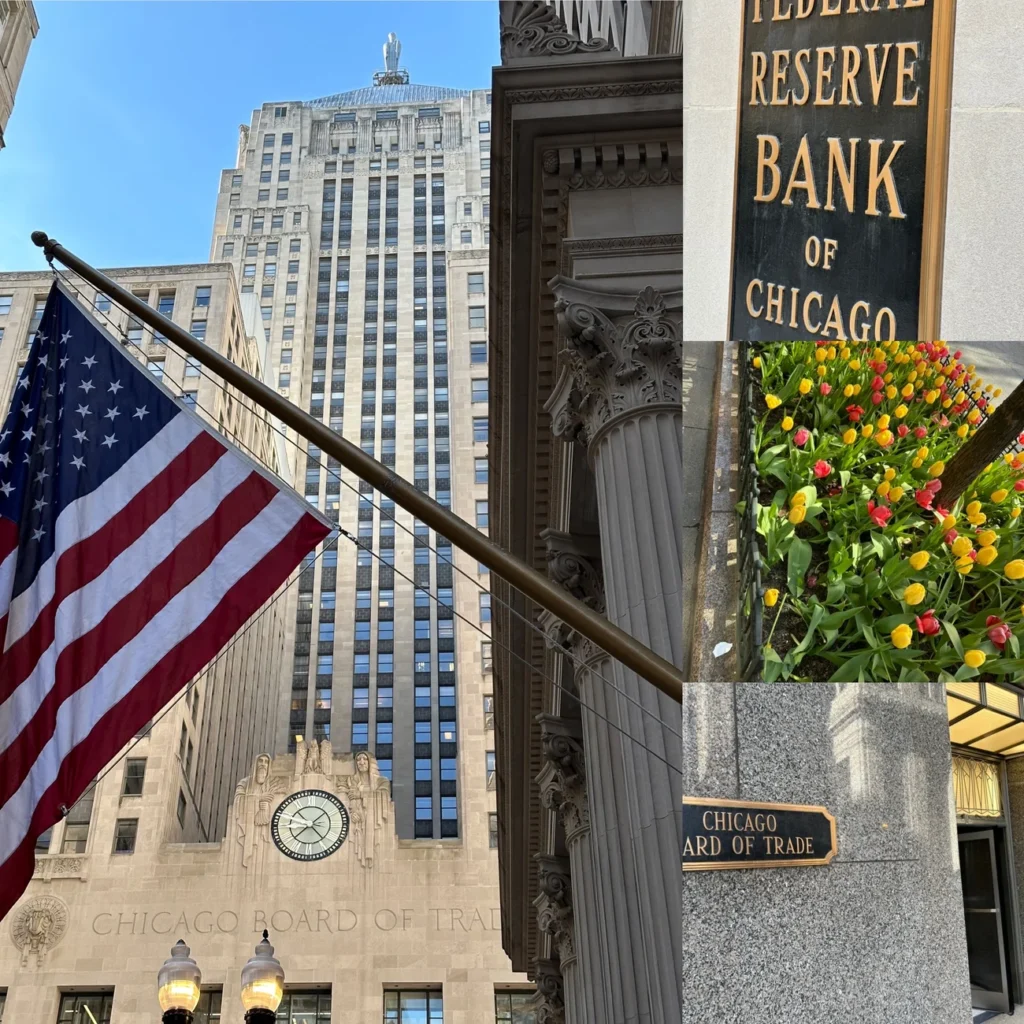
SO–I booked a trip to the Chicago…to do some meeting and greeting and a brief field trip to the Chicago Board of Trade. Its been awhile since I walked the floor and saw commodity trading in action. Nothing to report of value besides the visual and verbally stability of the “CBOT” and the Chicago Federal Reserve. The vibe is positive and that counts for something. The tulips concurred. Spring has sprung, indeed.
Let’s be the smartest cookies in the jar and extend our repitoire beyond that of the ever-present Gold conversation.
Copper fell 4% over the past seven days and gold dipped about 1%. Gold is flirting with its all-time chart high from August 2020, which was nearly tested in March 2022 and April of this year, but has since backed off – more to say on this later. Meanwhile, copper approached its chart lows from March 2023 and December 2022. There is a historically key relationship known as the copper-gold ratio that can offer a more meaningful understanding of the economy and forward expectation of the stock market.
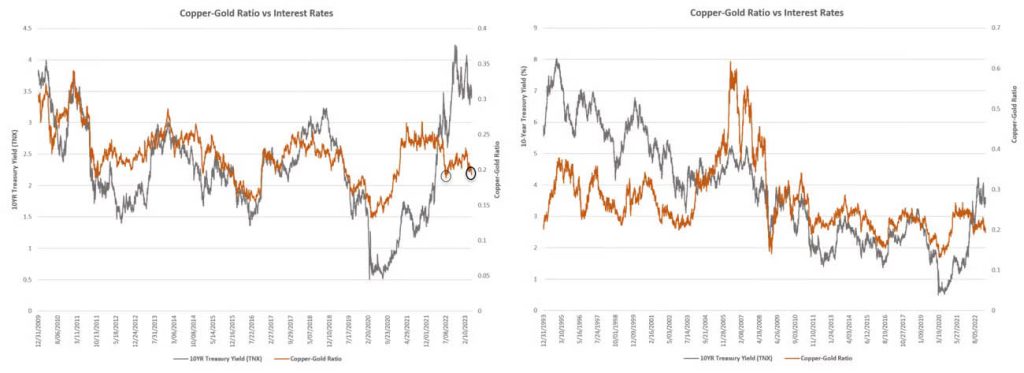
The copper-gold ratio (the orange line in the image above) simply takes the price of copper, divides it by the price of gold, and plots the reading daily. Put simply, when the ratio is rising that means copper is outperforming gold and when the ratio is falling that means gold is outperforming copper.
What is the significance? Gold is considered a safe haven for investors, and as an essentially useless metal from an industrial perspective, its role as a store of value is further emphasized. Rising gold prices have often signaled economic contraction and/or investor fear. Conversely, copper is a key industrial metal with countless economic applications, especially in building construction and electronics. Thus, copper tends to perform well when the economy is strong and/or when the economy is expected to be strong.
The grey line on the chart above is the US Treasury 10YR Yield–yes, we need to add in interest rates to the mix to be a credible economy/market indicator, RIGHT?!
NOTE, particularly in the longer-term chart on the right, interest rates tend to run parallel with the copper-gold ratio. Intuitively this makes sense because rising interest rates typically come during economic expansions and falling interest rates are often characteristic of accommodative monetary action taken during times of economic hardship.
The takeaway here is that the copper-gold ratio is nearing a past low (July 2022) and interest rates are also approaching an area of key support, each of which could suggest a technical turnaround opportunity for this relationship and consequently broader market expectations.
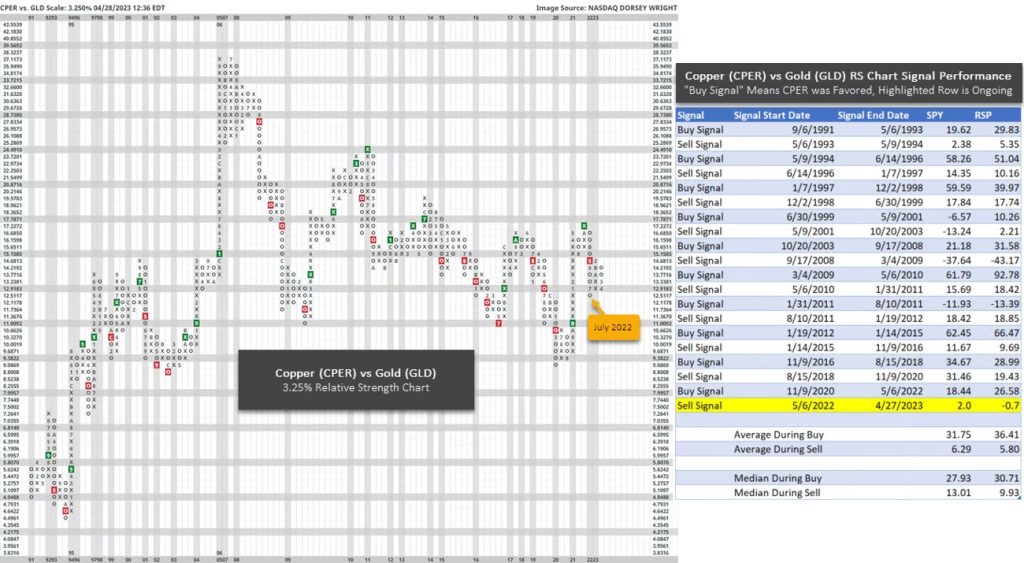
As it relates to equities, consider the image below. Our friends at Dorsey Wright helped construct this relative strength chart between the United States Copper Index Fund (CPER) and the SPDR Gold Trust (GLD). When this chart is in Xs CPER is outperforming and when the chart is in Os GLD is outperforming. The buy/sell signals (green and red boxes, respectively) are objective long-term indications of relative price strength while the columns Xs/Os indicate shorter-term trends of relative price strength.
While CPER was on a relative strength buy signal against GLD (green box on the chart below) SPY/S&P 500 generated an average return of 31.75% and a median return of 27.93%. While CPER was on a relative strength sell signal against GLD (red box on the chart below) SPY generated an average return of 6.29% and median return of 13.01% – which is not bad, but materially lower than when on a buy signal.
The current data suggests that this relationship too is nearing its July 2022 lows.
If gold continues to soften and copper strengthens the copper-gold ratio would rise which could be a good sign for markets and the economy at large.
Not too much more can be added by way of update not covered in the video above…International equities and interest rate topics also covered. Need more? I’m ready to meet–let’s do it!
As always, sending you all….a Perfect Day,

PS: Click here if you are not getting my 411 Weekly Newsletter…talk about color!
To schedule your review, please contact: Donna Hightower at 843-573-7277 or at Donna@wealthep.com