
2023 is here—I know most are joining me in welcoming January with open arms! That said, I am thankful for another year together. Let’s begin 2023 with a dose of education!
While 2022 will go down as one for the record books in many facets, looking at this past year against the history of asset classes ranking number 1 drives home the importance of adaptability over time. Some market environments provide definable long-term trends that investors can capture for extended periods, while others may require a shift away from what had been working.
Years like 2022 may require multiple changes to an allocation to navigate our “detour” and the route taken this time around may not be the same as last time. Utilizing relative strength provides somewhat of GPS to help us find the right potential route on the road to wealth building or retirement.
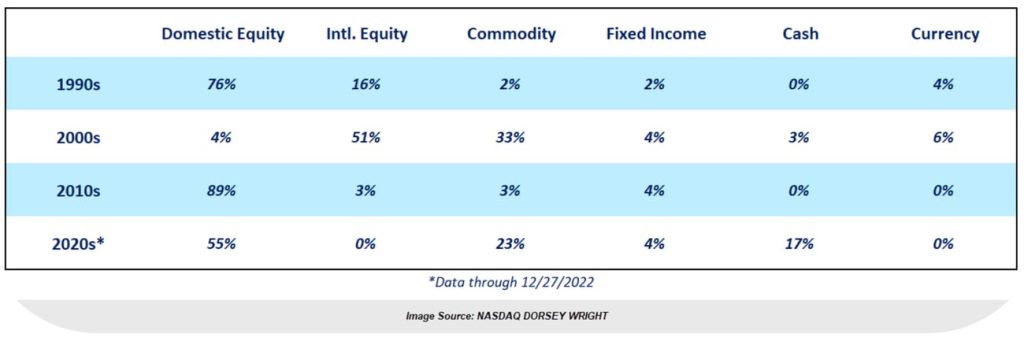
The tables below show the percentage of time that an asset class has been ranked number 1 within the Dynamic Asset Level Investing (DALI) line-up during 2022, as well as by decade going back to the 1990s. In 2022, three asset classes – Domestic Equities, Commodities, and Cash – all held the top spot within DALI. It isn’t often that three separate asset classes hold the top spot within DALI and the last calendar year in which three separate asset classes held the top spot was 2009. But while this number of changes to the top spot among the asset class rankings isn’t common, the adaptation that relative strength can bring about is important when the road may be rough.
Much like the holiday trips many have taken recently, sometimes a detour is needed to successfully complete the trip. In this sense, the “detour” is adapting to the changes within DALI; potentially overweighting (or underweighting) an asset class to limit the risk to clients’ assets.
In 2022, Commodities and then Cash moving into the top spot within DALI provides no better examples; see below:
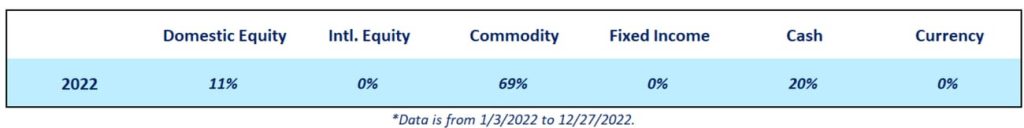
Commodities in the #1 spot for 69% of the year in 2022 created quite a difficult landscape for avoiding anticipated equity and fixed income sell-offs while attempting to also earn decent returns. The commodity space, volatile in nature, is much tougher to enter and exit due to excessive swings in performance. Add the Russian-Ukraine crisis and the fact that Energy/Oil was the top performing Commodity asset class, and you now see how Commodities wreaked havoc on most investors in 2022.
Here’s hoping we revert to much higher percentages in Domestic Equities in 2023 and the remainder of the 2020’s as we experienced in the 90’s and the 2010’s.
Finally, lets close with an excerpt on the The “January Effect.” This refers to the tendency of small-cap stocks (as a group) to outperform their large-cap counterparts early in the calendar year. However, when any seasonal trend becomes widely accepted, we tend to see the market adjust accordingly. In the case of the January Effect, we have seen this phenomenon move further forward in the calendar over the years.
According to the Stock Trader’s Almanac, “In a typical year, the smaller fry stays on the sidelines while the big boys are on the field. Then, around early November, small stocks begin to wake up, and in mid-December, they take off.”
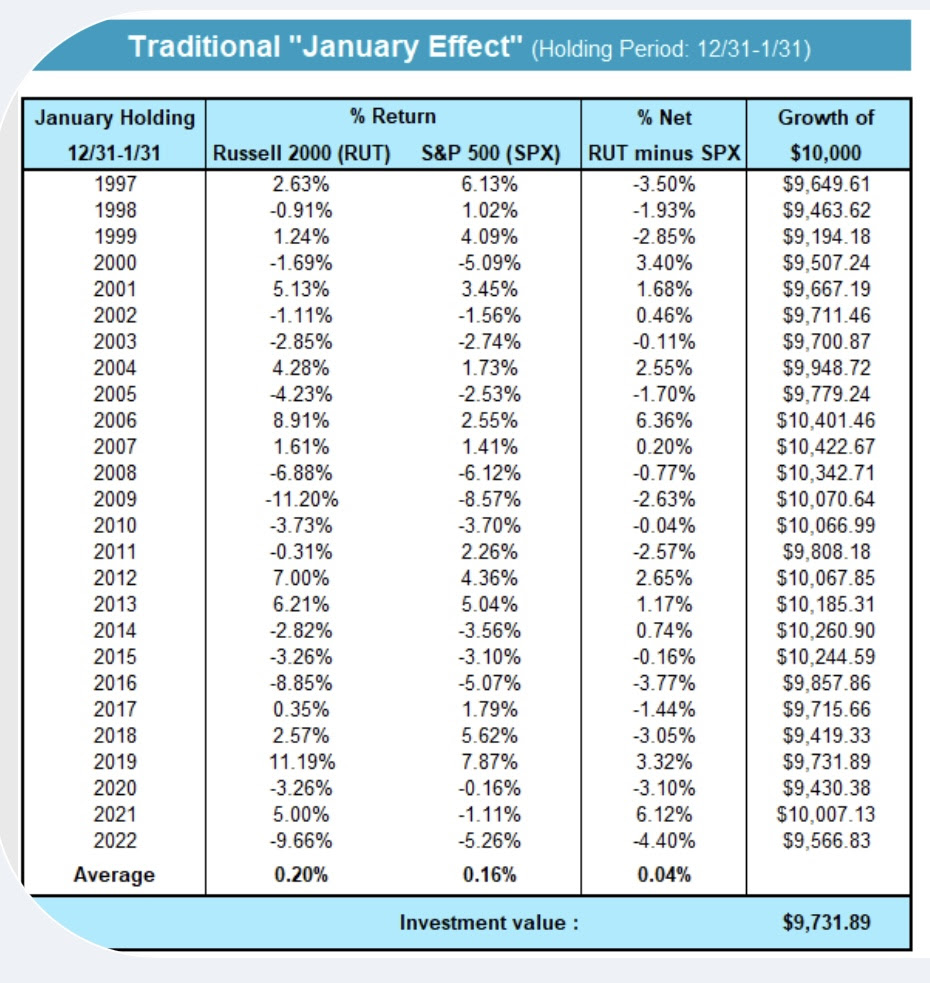

Consider the 2 tables above which examines the last 22 years of market activity, and the results of a theoretical $10,000 portfolio that would invest each year in the standard “January Effect” move. Accordingly, this table reflects the returns of someone buying the Russell 2000 Small Cap Index (RUT) and selling the S&P 500 (SPX), capturing the spread between the two.
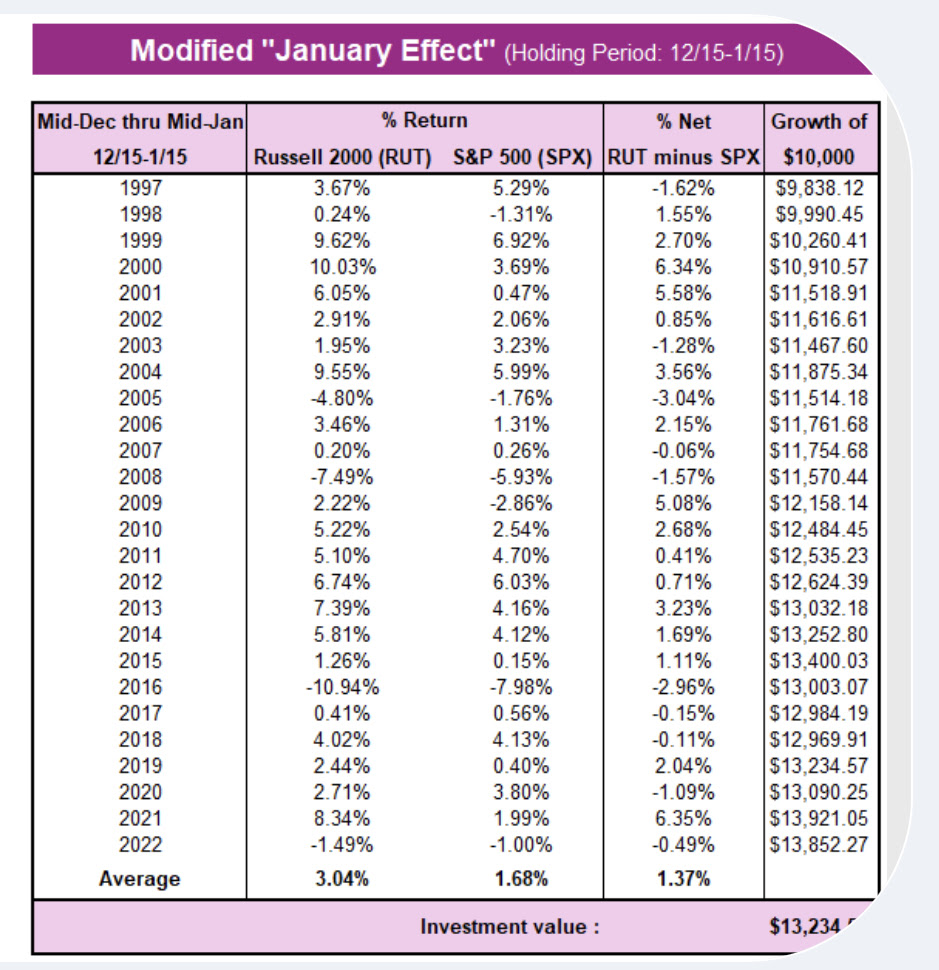
The first table shows the returns of someone entering this trade (based upon the closing price of each index) at the end of a year and holding the position through the end of January. As you can see, the results show no significant bias toward small-cap outperformance. The second table, however, captures the hypothetical returns of someone taking the same approach, but entering the trade in the middle of December, and holding through the middle of January. Since 1997, small caps have now outperformed large caps by an average of 1.37% during the modified holding period.
While the modified January Effect didn’t hold this year as the S&P 500 outperformed the Russell 2000 by about 50 bps, there was strong out-performance by small caps over the modified holding period in many instances but most notably 2009 (2008 DALI and otherwise was somewhat similar 2022) and 2021 as RUT out-gained SPX by 5.08% and 6.35%, respectively.
There is, of course, no way to know if the modified January Effect will play out in any given year. But in the final stretch of 2022, small caps are outperforming on a relative strength advantage as each small cap style – value, growth, and blend – sits ahead of its large cap counterpart in the DALI size & style rankings.
A final note to say that we added small cap exposure to the Tactical Models we manage mid-year, NOT because of the “January Effect,” or what past history shows about smaller company stocks, but instead because they were outperforming. The last 90 days has IJS (small cap value ETF) up 10.75% versus 7.08% for SPX . . . . both, moving in the right direction!
This, a long winded way to say—Happy New Year! Here’s to January and 2023–Sending you peace, health and many happy returns, now and always.
Committed to your financial success and grateful for another year,

Helen “Cokie” Cox, CFP®
Alphavest, CEO
Wealth Enhancement & Preservation, Managing Partner, Charleston