The Bullish Percent for the NYSE (New York Stock Exchange-BPNYSE) reversed down into a “column of O’s” at 62% on Wednesday. No, that wasn’t Latin–it was savvy-investor speak. Translated, it’s time for some a slightly defensive play-book when it comes to your portfolio. Is a gentle market exhale coming our way or a long overdue full-blown correction?
Dorsey Wright and Associates and I have been educating Liberated Investors for decades that the NYSE Bullish Percent measures the percentage of stocks that are on a Point and Figure (PnF) buy signal–THIS mother of all indicators helps us evaluate the “risk on the field” for portfolios hard at work. This indicator is a great tool to have–a risk meter on current markets, especially since the S&P 500 has rallied 11% since November 1, 2016.
NYSEBP Refresher:
If 62% of stocks on the NYSE are on a PnF buy signal, this is a tide you don’t want to swim against–it means 62% of stocks are doing well, and 38% aren’s doing so well–pretty good odds, right? Remember the bell curve you were graded on in high school? Most students would fall between 30-70% on the curve. The outliers were those students who got 100% on the test (above 70% on the bell curve) and those who failed the test (below the 30%). The majority of test scores, as you know fall in the 30-70% range–and so it goes with market returns; you’re best bet is to seek returns when they fall in the 30-70% range on the NYSEBP. Yes, great investment returns can be made above the 70-100% range, as is true in the 0-30% range. But the risk is greatly increased in those ranges–there are few stocks (students/scores) that perform in those ranges, but much more likelihood in the 30-70% range.
So, how do we apply the NYSEBP to evaluate “risk on the field?”
Without going too deep, for yesterday’s reversal purposes, just focus on this; a 6% decrease (or increase) in the NYSEBP, going back to its root of the early 1950’s (this isn’t a wild new concept some Harvard grad just discovered!) is a statistically significant move–one that warrants attention to current portfolio holdings.
What’s been happening with the NYSEBP lately?
The NYSEBP climbed up to the 68% level in January, but has since taken a breather. This reversal is an indication that we are seeing more stocks move from buy signals to sell signals and this changes the name of the game of investment management from one of wealth accumulation to that of wealth preservation.
Sell Everything and run for the hills?
Certainly not. We expect this Bull-Market-Trump-Rally to continue throughout 2017, even as interest rates continue rise. I offer that this defensive shift may be short lived and may aide us in side-stepping a routine market exhale, a small breather. So for now, we’ll go a little more cautious and may trim our big winners a bit. In the meanwhile, remember #We’veGotYouManaged.
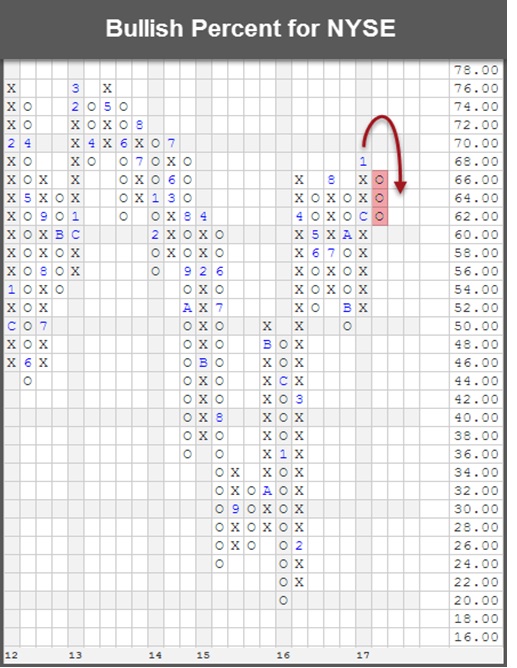
The Bullish Percent indicator measures the percent of stocks in a given universe that are on a Point & Figure buy signal. This percentage is plotted on a grid from 0% to 100%. Xs represent stocks are moving to buy signals, and the offensive team is on the field for that universe. Os represent stocks falling to sell signals, and the defensive team is on the field for that universe. There are two lines of demarcation on a Bullish Percent chart at 30% and 70%. The 30% level and below is the “Green Zone” or low risk area. The 70% level and above is the “Red Zone” or high risk area. Bullish Percent indicators are a measure of risk in the market, not the direction an index should move.