
October has gotten off to a roller coaster start, while posting almost 3% in gains so far this month. That said, and given my earlier communications both verbally and in email updates regarding past years’ positive market performance, post mid-term elections—I bring you today new information that doesn’t appear to be very supportive of continued gains in the coming months.
What I have been communicating:
We have no way of knowing with certainty whether the months to come will follow suit with the historical tendencies following mid-term elections. However, one interpretation of the data could circle back to the concept of financial market participants feeling more comfortable with defined expectations. This would maintain that markets rise in the first year of a presidential term as the uncertainty from the presidential election is alleviated.
The second year comes with an enhanced potential for market weakness amid new uncertainty from upcoming mid-term elections. The third year would then show the strongest returns as the mid-term elections both remove the congressional uncertainty and indicate which direction the country may lean in the next presidential cycle. Sounds plausible, especially given that the 2022 mid-term dismal performance stats have fallen in line historically (S&P 500 down almost -22% YTD), that next year, the third year could also follow historical norms and be positive for the market.
The not so rosy update:
Compare and contrast the mid-term viewpoint with the reality these two hefty indicators recently signaled, in tandem (important), similar signals to that of the bear markets of 2000 and 2008. Yes, a negative outlook relative to the short-term direction of the market. NOT exactly what I wanted to share with you. However, you deserve to know what we are evaluating.
While we do have common data going back to 1967 with these two tools of measuring risk on “the investing field,” the strongest correlation with both indicators signaling to either own cash or be “short” the S&P 500 happens to be now, and the bear markets of 2008 (S&P – 38%+, 10 month peak to trough) and 2000 (S&P -26% 25 months peak to trough). Said simply, right now, despite what we’ve already experienced with markets this year so far, these indicators strongly suggest that we may see further downside from current market levels.
This year has proffered many firsts for markets; firsts in indicators getting things “wrong,” firsts in heightened volatility—daily market swings and the size of the swings, firsts in Asset Class switching frequency (6 times YTD!). Yet the tandem nature of the S&P 500 v. Cash and the S&P 500 v. SH (short the market) indicators, having both triggered, now, and having done so in tandem, is NOT a first.
We have seen this before—the most recent occurrence in 2008, and prior to that in 2000. While I hope that this will also be a first—the first time that the two indicators trigger in tandem and a market sell-off doesn’t follow suit—this data is something we have to digest and take seriously.
Take a look at the below scenario of the success—and lack thereof, with trying to time the market by switching to cash and back into the market using these indicators;
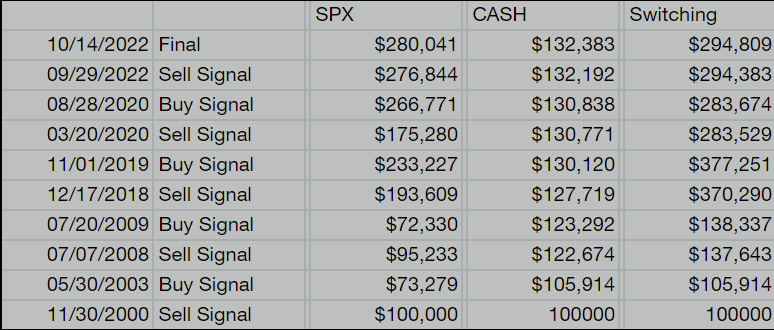
Note; there may be “sleep at night” benefits with the above switching scenario. The $14,768 ($294,809-$280,041=$14,768) cumulative difference/benefit to switching to cash and back into the market since 2000 isn’t overwhelmingly convincing. Still, in 2000, it would’ve felt good to have switched to cash as would have been the case in 2008. I feel it’s safe to assume you’d agree.
The net benefit doesn’t necessarily make a case, today, that a switch to cash is NECESSARY for your long-term portfolio success—especially given the losses YTD most investors wish to recoup.
Its also worth noting that the signals above in 2018, 2019 and 2020 were NOT affirmed by the second indicator, the S&P 500 v. SH. While the solo trigger would’ve produced positive results in switching to cash, the nature of a double-confirmed trigger is what makes the current two signals corroborating one another, today, more noteworthy of attention.
What should you do, if anything?
- Determine your time horizon on your investment accounts; taxable accounts have the shortest of the horizons, while IRAs and 401ks and Roth IRAs typically have the longest time horizon—the date at which you intend to start withdrawing.
- If you have 7-10+ years before you need to use your investment dollars, you may do well to simply sit tight. Otherwise, perhaps further de-risking of your account may make sense.
- Increase your monthly personal savings and/or 401k contributions. While it seems counterintuitive to invest/save more during down times, know that the experts have it right when they say, “Buy when blood is in the streets.” If those savings are i-Bonds at 7-9%, or increasing the amount of employer match or tax deduction you’ll get this year from increased IRA or 401k contributions—even if held in cash and not invested, investors will all be better off.
- KNOW THIS; if you have not heard directly from me, then your accounts will be de-risked with additional cash and/or commodities, as I feel is appropriate for your expressed time horizon, risk and objectives given this new market data, without a call or email. I don’t want you to feel a response is needed in order to continue to manage your assets, with discretion, as we always do.
- If you feel these developments may have shifted your thoughts or risk tolerance, please call so that we can discuss all of this. (843) 573-7277.
- Thank you for the opportunity to collaborate and construct strategic opportunities to help grow and preserve your hard earned investments.
- Committed to your investment success!
Best,

Helen “Cokie” Cox, CFP®
Alphavest
843-573-7277
alphavest.com