
A whole lot of data for you today —
Equities remain in the #2 spot amongst asset classes, yet find a strong challenge from CASH is underway. Moderate to Conservative clients will see increased cash as of today as a result.
For those with longer time horizons, it may be getting close to the time to “buy when blood is in the streets.” AND, you can count on us to pivot our models to take opportunity, when indicators signal.
We still continue to own a great deal of cash and are still invested in #1 Asset Class, Commodities; oil, energy, agriculture.
Given the environment, most want to know are we on the brink of another 2008? The Feb 2008 Asset Scale was as follows (6 months in advance of the 38% sell-off):
#1 Commodities
#2 Currencies
#3 International Equities
#4 Domestic Equities
#5 Bonds/Fixed Income
#6 Cash
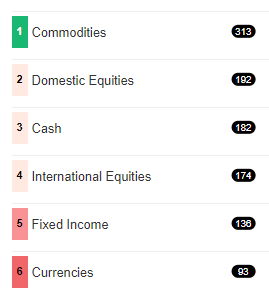
Currently, Domestic Equities is actively being challenged by CASH—if Cash does overtake Domestic Equities, this places the only 2 “risk-on” equity classes out of the top 2 positions (key)—signaling something similar to what we experienced in 2008. In this case all client allocations will see in increase in cash in their portfolios of 20-40%, depending upon your risk/allocation. See below the asset scale as of today;
Some additional stats for those interested:
Friday’s reversal on the NYES Bullish Percent index (BPNYSE) was the seventh column change for BPNYSE this year (the indicator I use the most when determining the rising or falling tide versus the major indices followed in the news). 2021 and 2020 were each volatile years for the indicator, but if looking beyond those years, this is the most column changes we have seen in the first half of any year since data beginning in 1997.Interestingly enough, in past times when we saw an extreme number of column changes to start the year, the major equity benchmarks finished with a modest gain, but note those years were quite messy beneath the surface. One can hope—yet i am keenly aware that ‘hope is not a strategy”—instead, I am slave to the indicators which led us well in 2008 to commodities and non-equity asset classes many months ahead of the last significant bear market recession.
We are currently at day 161 on the S&P 500 on its decline from its high at the beginning of January through trading Monday. This is longer than the last two bear market declines (2009 and 2020), but still beneath the historical average peak to trough decline length. While we saw the S&P 500 find a bottom within two weeks of the 2020 decline, we should not necessarily expect that to occur again in this instance.
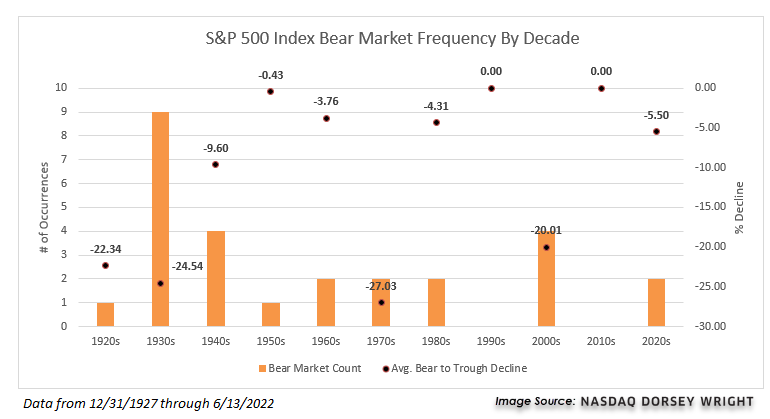
It takes the S&P 500 just over 100 days on average to move from the bear market decline to the ultimate bottom, with a median of 68 days. However, if we cluster the bear markets by decade, we can see that most time periods do not see a further decline much worse than another 10% lower from the date that SPX entered a bear market. The exceptions were the 1920s, 1930s, 1970s, and 2000s. Looking at the historical data another way shows that the average bear market sees a 17% further decline from the index value after it has already declined 20%. See below:
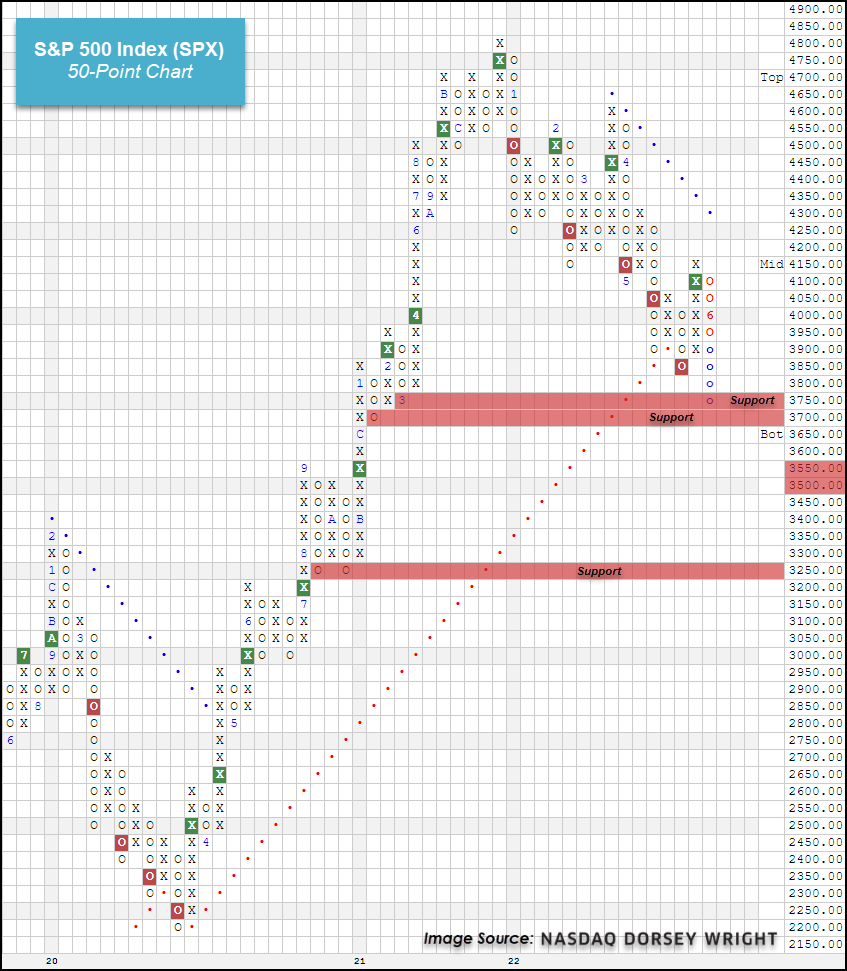
The latest market action saw the 50-point chart of SPX break a double bottom at 3800, marking a new 52-week low before continuing to 3750 by Monday’s close. We see notable support at 3750 from March 2021 and further support offered at 3700 from last January. The index would need to fall to 3650 to potentially violate both these support levels, which would also leave SPX near the bottom of its current 10-week trailing trading band. Further support from there may be seen on the 25-point chart at 3550 and 3525 from November 2020. Additional support on the 50-point chart is seen at 3250, which served as strong support in September and October 2020. That threshold would also align with a -32% decline from the SPX all-time high seen at the beginning of this year, which is about the average decline seen by SPX during prior bear markets.
This is not to say that we are expecting the S&P to fall to these levels. Rather, we feel it is important to be aware of potential support levels to look toward should the weakness in the broad market continue. The sharp decline seen over the past two days has led SPX into an oversold territory at a -83% intraday oversold reading Monday. These oversold levels have seen SPX rally toward the middle of its trading band throughout the last few months which will be important to monitor over the next few days to see if the current support position holds.
As always, I will keep you all up to date with any further observations or developments over the coming days.
Remember: I will repeat something you hear from me often: WE ARE STOCK AGNOSTIC.
If stocks are not one of the top 2 traded assets classes, we will be void stocks or stock-light. As evidenced in your portfolios for the last 3 months—there are ways to earn returns in the market outside of traditional equities/stocks (our commodity positions and holding cash)–focusing today on your risk level and finding yourself in the proper allocation will ensure that you are one of the investors who “gets the money” as mentioned above. Some of you need to be on the sidelines—and you are, and increasingly so with increased cash positions until the risk on the field is clearer and less volatile.
Let’s chat! Taking any and all call/Zoom requests if you need some reassurance and or information on where you portfolio stands. I’m committed to your success!