While (media and otherwise) Noise can confuse at volatile times like these, I wanted to impart some facts—data to frame where we are and what we’re doing and what we plan to do:
NOTE: herein in will be quite technical in nature. Don’t get overwhelmed, instead digest the Take-Aways and simply see where you land. Call us and let Cokie demystify the technicality of the data.
FACT:
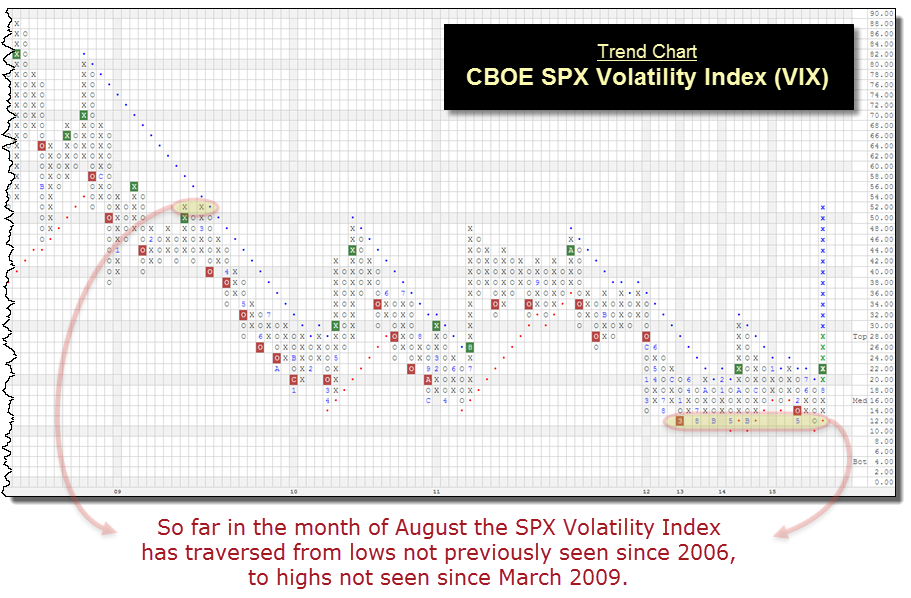
VIX (CBOE SPX Volatility Index) trading range is extreme.
While the month is not yet over, Fthe high of 53.29 and low of 10.88 creates the largest monthly trading range for VIX on record (using data since 1990). Previous months with similarly expansive trading ranges include October 1997 (Asian Contagion), May 2010 (Flash Crash) and Sept. 2008 (Lehman Brothers).
TAKE-AWAY:
In extreme volatility observation is key–don’t react or engage in “investor bad behavior” by selling or buying at the wrong time.
Stay disciplined to a strategy that is suitable to your risk and financial needs. What are your cash-flow needs and what precautions are in place to safe-guard that portion of your portfolio? If you don’t know, book a call today to get this question answered.
FACT:
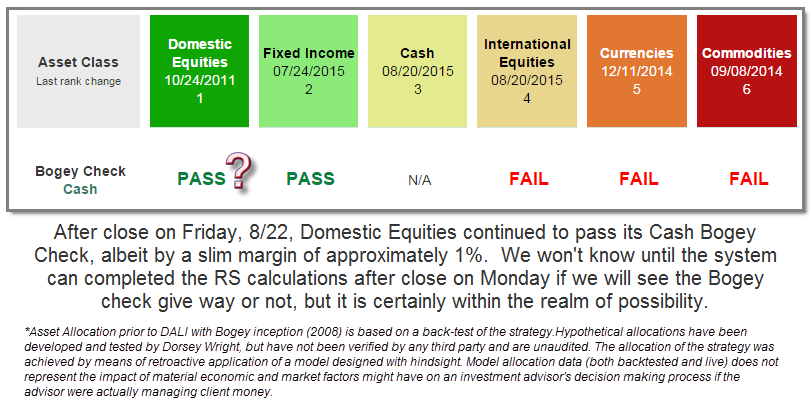
Domestic Equities, our #1 ranked Asset Class, failed its “Cash Bogey Check” yesterday. What does this mean?
Stats about Cash Bogey Check for US Equities:
- There have been a total of 20 failed Bogey Checks for US Equities (going back to 1994), and the average number of days that the RS charts remained in a column of O’s (sell signal) was 92 days, or about three months.
- The longest period of time in which the Domestic Equity Cash Bogey Check chart was in O’s was from October 2000 to April 2001, for a total of 194 days. On the other hand, the shortest stint in O’s was just 19 days in November 2008.
- Of the 20 previous reversals into O’s, 7 resulted in losses for the S&P 500 Index SPX with an average of -11% during those seven instances. The worst return was from June 30th, 2008 – October 30th, 2008 as the SPX returned -25.46% while Domestic Equities “Failed” it’s Bogey Check.
- The last time Equities “Failed” its Cash Bogey Check was from June 1, 2012 thru September 6, 2012, over which time the S&P 500 Index was actually up 12.06%.
TAKE-AWAY:
Now is a real-time opportunity to reassess your risk tolerance to determine if your portfolio should abide by the Bogey check fail, shown above.
If you feel like you need to reassess your risk tolerance, call Cokie to discuss what is most suitable for your portfolio; will you be OK with missing the upside in the 2012 example above whereby 12.06 upside might get missed by honoring the Bogey check fail right now—or would you prefer to take that “risk” and potentially mitigate further losses? Again, if your cash-flow needs are properly allocated to “risk-off” assets, AKA cash and low duration bonds, we would advise to let your risk assets ride out the failed Cash Bogey Check, until additional indicators say otherwise.
Fact:
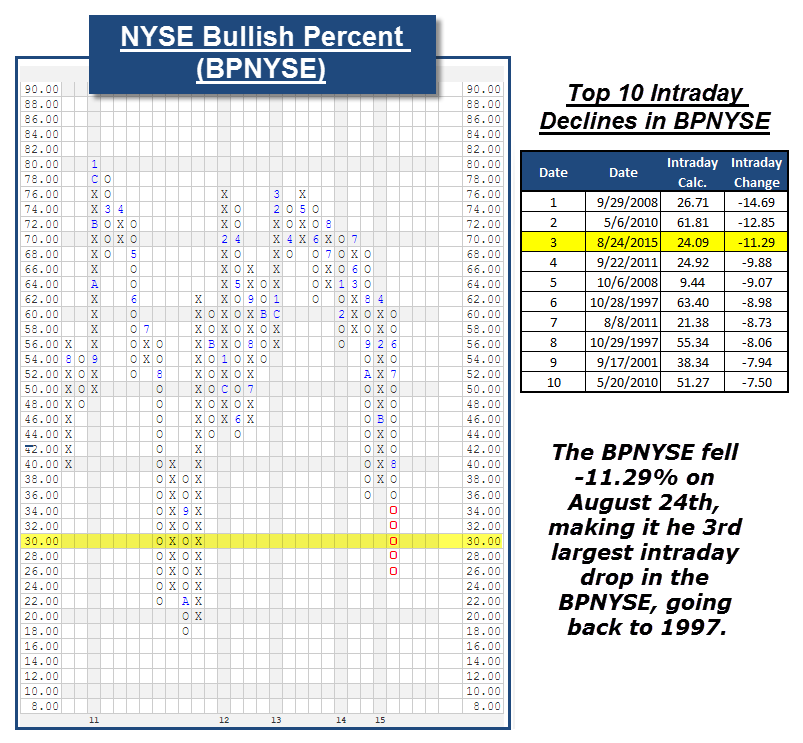
Our king of indicators, the NYSE Bullish Percent, Falls into Oversold Territory
Monday’s market saw the NYSE Bullish Percent BPNYSE fall more than 11%, which is the third largest daily decline in the BPNYSE since 1997. Based on the intraday reading, the BPNYSE is at 23.4%, which simply means that only 23.40% of stocks on the NYSE are on buy signals. The other side of this is that nearly 77% of the NYSE stocks are on sell signals. This move in the BPNYSE also causes this indicator to fall below the 30% level, or into the green zone. Historically, the BPNYSE has fallen below 30% once every 3 to 4 years, and it was 4 years ago to the month that the BPNYSE initially fell below 30% before ultimately bottoming at 18% in October 2011. While it is never a “comfortable” feeling to get the BPNYSE down to the 30% level, historically we have seen attractive buying opportunities come from these oversold levels. We will anticipate more from here, but will watch the development of this indicator closely. As for now, this indicator would continue to be viewed as negative, yet the indicator is in oversold territory.
TAKE-AWAY:
The risk in stocks is when the NYSE is above 70%, not below 30%.
A repeat of Monday’s post, as I believe it bears repeating….
So what now? Like sugar and carbs, limit your intake of media noise. You ARE a Liberated Investor—you’re savvy and wise.
- You’ve entrusted an advisor who does not employ emotion at times like these.
- You nor your advisor subscribe to a buy and hold methodlology therefore, you’ve shifted for this event and your portfolio will continue to do so as indicators/rules dictate.
- The fees you pay are LOW—this helps in time of negative returns.
- No conflicts of interest exist in your portfolio of stocks and ETFs; you can trust that you are invested where the opportunity is for YOU, not your advisor’s checkbook.
The above MATTERS. Take stock in where you ve landed and trust what you already know; timing markets is a proposition of hope and luck. We don’t subscribe.
Guidance by indicators that steer us away from stocks in Bear Markets is a data driven approach that isn’t subjective—to THIS, we subscribe. We aren’t in a Bear Market—so quiet the noise and know that we have you managed.
Be a different investor—BE a Liberated Investor; one who shuns the drama of the media and your neighbor. One who sleeps at night because you know a data driven logical plan is in place. These times are not fun, by any mean, nor do we have on rose colored lenses
Contact us if you have any questions–or need a dose of Liberated Investing. Just remember: We’ve got you managed.
As always, thank you for your feedback as we try to keep you updated on the market and your investment portfolios. Lets lock arms, and hunker down, TOGETHER. NOW, more than ever, we want to hear from you!