
Equities remain in the #2 spot amongst asset classes and despite yesterday’s sell-off, the NYSE Bullish Percent (NYSEBP) is offering a more detailed look “under the hood” that a monkey may miss if not paying close attention. Read further on the NYSEBP silver lining….
ALL of allocations continue to outperform on a 3 month, and 1 year basis as we continue to increase our “Bearish” allocations;
This basically means we have increased cash and are still invested in Commodities—oil, energy, agriculture and are now void metals/gold due to a violation of its positive trendline last week.
Moderate to Conservative clients have even more decreased exposure to stocks and bonds and hold more cash.
Speak now on your risk level if something material has changed—NOT how the market is making you feel—but a material change to; income status or a need for earlier withdrawals from investments than previously planned for-inside of 3 years. Cash allocations have been increased for Moderate to Conservative clients based on short-term indicators where both the equity and fixed income asset classes have failed a “cash bogey check.”
For the optimist AND the realist:
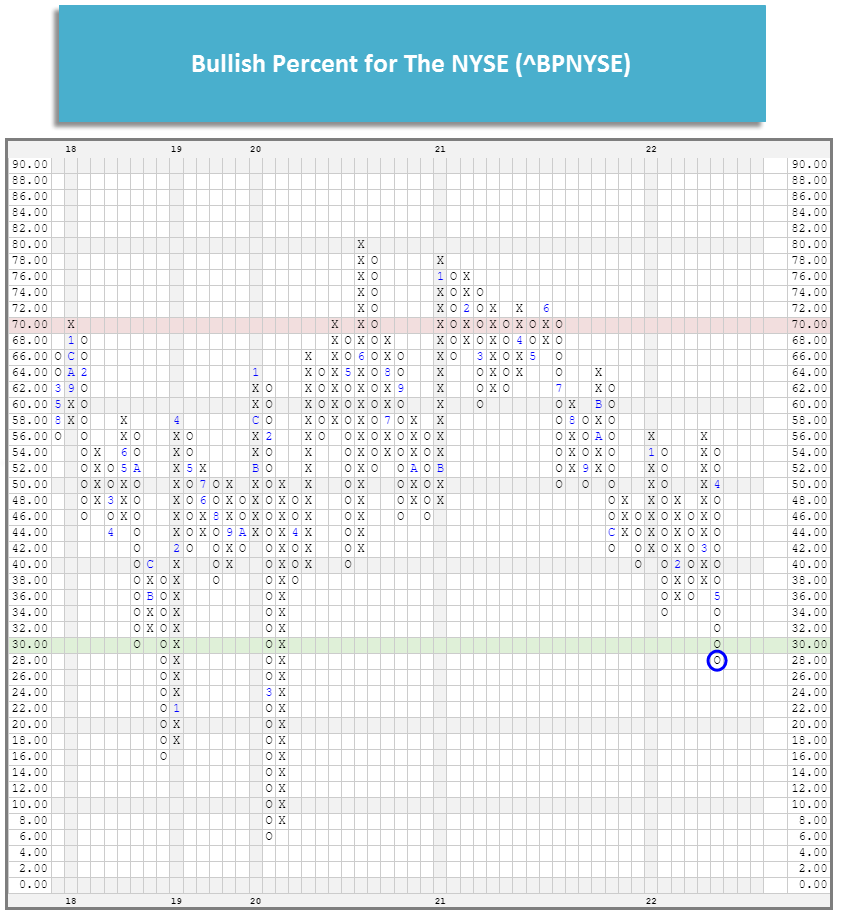
Last week, the Bullish Percent for The NYSE (BPNYSE) crossed below 30% for the first time since 2020. The 30% and below level on the BPNYSE can be referred to as the “green zone;” historically, reversals up from below this level have often presented some of the best buying opportunities. However, trips below 30% and the time waiting for a reversal up can be “uncomfortable.” Yesterday, point in fact.
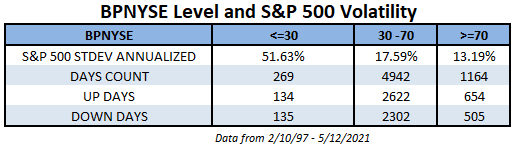
One way to quantify the “uncomfortable” nature of the markets while the BPNYSE is at or below 30% is simply by looking at the volatility (standard deviation)—the ups and downs of the market. Since February 1997 the BPNYSE has only spent about 4.2% of the time at the 30% level or below, while nearly 78% of the days the BPNYSE sits between the 30% and 70% level. While most of the past 25+ years have been spent between 30% and 70%, a large chunk of market volatility has come while below the 30% level.
When the BPNYSE is between 30% and 70% the annualized standard deviation of the S&P 500 has been just over 17.5%; however, while the BPNYSE has been below 30% the standard deviation has been nearly 52%, or almost three times as high. We can also see that while the “up days” outnumber the “down days” when the BPNYSE is in the 30-70 or 70+ level, when the BPNYSE is below 30 there is roughly an even split between the up and down days. (See both images below.)
I assume its not hard to convince you that we currently find ourselves in a highly volatile state for the market, but know that these levels on the BPNYSE offer some of the best buying opportunities. But, as the saying goes “the time to buy is when there’s blood in the streets” and blood in the streets means panic, which means volatility.
A client this week very cynically asked, “when we are all losing money in the stock market, who gets all the money?” I answered Wall Street (monkeys who over charge clients to underperform), and savvy investors. “Savvy investors?” the client asked. I then explained that when investors sell stocks (market jitters—when “blood is in the streets”) that someone is BUYING on the other side. It is typically THOSE investors who ‘get the money” that scared investors “lost” when they sold at an inopportune time.
Said another way, if you’re able to enter the market after panic has subsided you can generate some truly amazing returns coming off the bottom. That is also a risky proposition because these extreme up and down days are often clustered closely together. This was perfectly illustrated in 2020 as six of the largest single-day moves in history occurred on consecutive trading days from 3/13/20 to 3/18/20.
We tend to think of the cross below 30% as the time when we should start thinking about offensive strategies and looking for a reversal. Although in some instances, there has still been a significant amount of pain after the cross below 30. In 2020, the BPNYSE crossed below 30% on February 28th but didn’t ultimately bottom for nearly a month, leading to a further decline of more than 24%.
To repeat, an initial move above 30% is NOT a call to step all the way back into the market—Remember that past market environments were not all V-shaped recoveries like in 2018 and 2020; sometimes we can see the indicators chop back and forth at low levels. However, the reversal from a low level is an indication of increased participation as positions have moved back to buy signals. It is also an indication that we as investors may begin to increase our exposure since participation is also increasing. Still, it’s not a situation where we move back “all-in” out of fear of missing the rally. We must and WILL consider the technical picture of all new positions and allocation shifts. Bottom Line: we are anticipating and will be ready to follow indicators to better this year’s current losses.
Reminder: I will repeat something you hear from me often: WE ARE STOCK AGNOSTIC.
If stocks are not one of the top 2 traded assets classes, we will be void stocks or stock-light. As evidenced in your portfolios for the last 3 months—there are ways to earn returns in the market outside of traditional equities/stocks–focusing today on your risk level and finding yourself in the proper allocation will ensure that you are one of the investors who “gets the money” as mentioned above. Some of you need to be on the sidelines—and you are, and increasingly so with increased cash positions until the risk on the field is clearer and less volatile.
Let’s Chat! Taking any and all call/Zoom requests if you need some reassurance and or information on where you portfolio stands.