
All Weather Status: Score 40 out of 40
The All Weather portfolio was in the Aggressive allocation during February.
The All Weather Moderate portfolio was in the Moderate allocation during February.
* Performance and Benchmark Indexes
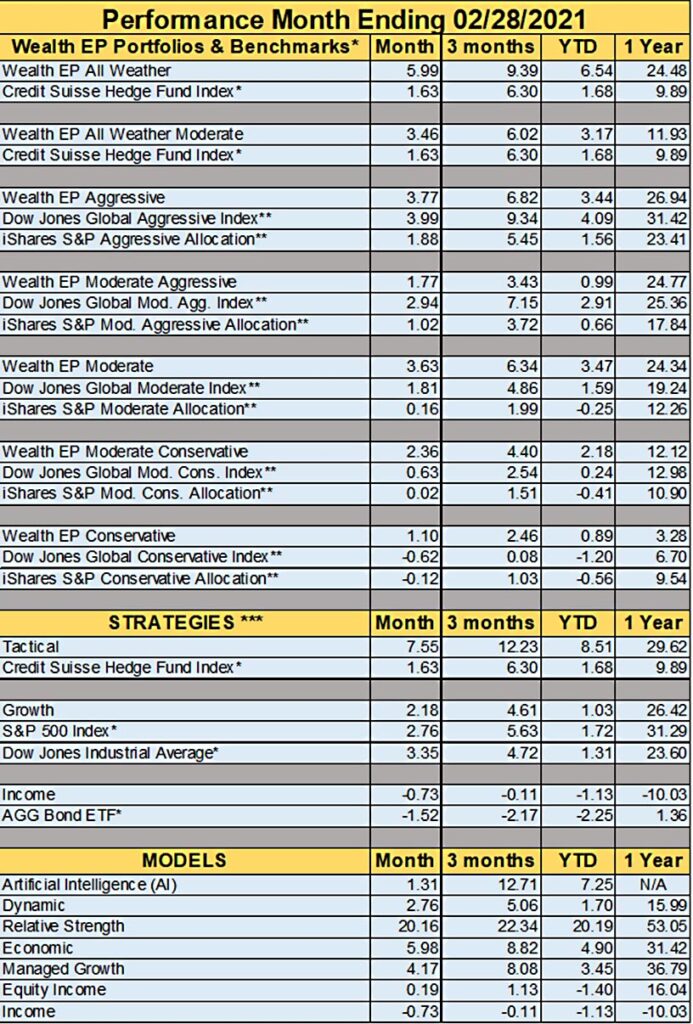
All performance numbers (month, 3 months, YTD, 1 year) are shown net of our standard annual fees of 1.50% using our model portfolios. Your performance may differ due to many factors not limited to but including fee structure, investment timing, and portfolio allocation. We have found it difficult to find the appropriate benchmark for clients to compare our portfolios against since we are both tactical in nature and heavily diversified. In an effort to give you benchmarks, but to try not to focus on the wrong benchmark, we will provide several market indexes for your assessment.
The Credit Suisse Hedge Fund Index The Credit Suisse Hedge Fund Index is the industries first and remains the leading asset-weighted hedge fund index. The index represents at least 85% of the AUM in the hedge fund universe as defined by the index methodology. (https://lab.credit-suisse.com/#/en/index/HEDG/HEDG/methodology)
The Barlcays Capital Aggregate Bond Index which used to be called the “Lehman Aggregate Bond Index,” is a broad based index, maintained by Barclays Capital, which took over the index business of the now defunct Lehman Brothers, and is often used to represent investment grade bonds being traded in the United States. It reflects investment in a portfolio of all bond types, not just corporates. (https://ecommerce.barcap.com/indices/index.dxml)
The Standard & Poor’s 500 (S&P 500®) is an unmanaged group of securities considered to be representative of the stock market in general. It has been widely regarded as the best single gauge of the large cap U.S. equities market since the index was first published in 1957 (http://www.standardandpoors.com)
The Dow Jones Industrial Average (DJIA) is a price-weighted average of 30 significant stocks traded on the New York Stock Exchange and the Nasdaq. The DJIA was invented by Charles Dow back in 1896 and is considered the world’s first stock market indicator. (http://www.djindexes.com/averages/)
** The S&P Target Risk Index Series is comprised of four multi-asset class indices, each corresponding to a particular risk level. The asset class mix is determined twice a year through a process designed to reflect the overall investment opportunity of the represented markets. Each index is fully investable, with varying levels of exposure to equities and fixed income through a family of exchange traded funds (ETFs). These indices are intended to represent stock-bond allocations across a risk spectrum from conservative to aggressive. The assigned risk level of the index (conservative, moderate, growth, and aggressive) depends on the allocation to fixed income. (http://us.spindices.com/documents/methodologies/methodology-sp-target-risk.pdf)
** The Dow Jones Relative Risk Indices measure the performance of an index of indices that consist of varying percentage allocations to equity, fixed income, and cash indices to represent a respective level of relative risk. The family includes global and U.S. indices for five risk profiles-aggressive, moderately aggressive, moderate, moderately conservative, and conservative. These profiles are defined based on incremental levels of potential risk relative to the risk of an all-stock index. (https://us.spindices.com/index-family/target-risk/relative-risk)
Indexes cannot be invested in directly, are unmanaged and do not incur management fees, costs or expenses. Asset allocation and diversification do not assure or guarantee better performance and cannot eliminate the risk of investment loss. Due to volatility within the markets mentioned, opinions are subject to change without notice. Information herein is derived from sources believed to be reliable; however, accuracy or completeness cannot be guaranteed. All economic and performance data is historical and not indicative of future results.
***STRATEGIES
Our 3 main strategies are identified as “Tactical”, “Growth”, and “Income”. Investments are distributed evenly within the major strategies, unless otherwise indicated.
Tactical consists of 4 portfolio models equal weighted (25% each): Artificial Intelligence (AI), Dynamic, Relative Strength, and Economic. Each model uses different, clearly defined decision processes to make trades. Tactical models tend to be more actively traded than our Growth and Income models.
Growth The Growth strategy is equal weighted in the Managed Growth and Equity Income models (50% each).
Income is a single portfolio model that invests 25% each in two bond funds: iShares Aggregate Bond ETF (AGG) and PIMCO Income Fund (PIMIX); 20% in the First Trust Low Duration Strategic Focus ETF (LDSF). The remaining 30% is invested equally in: Real Estate Investment Trusts (IYR), Ares Capital (ARCC), Utilities (XLU), Senior Loans (SRLN), Health Care (IYH), Preferred Stocks (PFF), S&P 500 Buy-Write ETF (PBP), and Convertible Bonds (FCVT).
Advisory Service offered through Infinite Asset Management Infinite Asset Manage and Wealth Enhancement & Preservation are not affiliated with Triad Advisors, LLC.