Quiet the Noise (Listen to the Data):
Below you will find a “temperature reading” on the market and the risk level on the “field.”
Relative Strength Line Up of the Asset Classes:
Q4: Cash and Commodities continue to switch places back and forth, but for now, UNCHANGED.
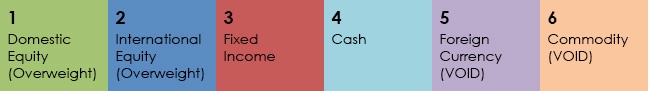
10/1/2014:
- #1 Asset Class: Domestic Equities
- #2 Asset Class: International Equities
- Market Status: BULL
- NYSE Bullish Percent: 53.06% (DOWN from 69.85% Q3) DEFENSE (Reversed down from Offense on 7/31/14)
Perspective, Perspective…
Last quarter my commentary “warned” of an NYSE Bullsih Percnet getting close to 70% and what that might mean for markets and portfolios. As a small refresher…
The holy grail of Alphavest’s risk metrics is the NYSE Bullish Percent Index. A reading over 70% changes which play book we will use for investment selection and portfolio design. Is this bad or scary to have a reading of 70%+? NO. It simply means that above 70%, only 30% of stocks need to improve to a “BUY” status—basically a pretty chart of upward performance. And 30% isn’t much, so, while a tide running at 70% is one that we never swim against, AKA selling or taking profits at this time, it is a time to make some more conservative investing decisions. It may be exhale time, in other words, and we will be prepared given the play book switch.
So what happened? On 7/1, the date of the last newsletter, the NYSE BP sat at 69.85% and never moved above 70% and has steadily charted downward to the 10/1/2014 reading of 53.06%. A very healthy correction in the number of stocks trading on a buy signal, AKA a very healthy correction in the risk level on the “field.” This is a 24% decline in the NYSE BP—so, 24% of stocks trading on the NYSE are no longer trading on a “buy signal.” Pretty big move, right?
So, here’s the perspective (and of course my lesson for you to follow…give you a hint, RULES, RULES, RULES!); Markets are FLAT since 7/1. That’s right, FLAT. So, even though the NYSE BP can reverse 24%, markets are FLAT. This is why we stay true to our indicators, which so far, have told us to do little, versus listening to the noise, or our “gut” and leaving the party early, before we were supposed to.
If we had reacted to the gloom and doom of all the market “noise” and the idea that 70% on the NYSE presents a “high risk” market, we wouldnt have been obeying our rules and logic. No MARKET TIMING here—which doens’t mean we are buying and holding either, we are simply abiding by our data driven, stricly disciplined rules based Liberated Investor Model (TM). What did we gain from being disciplined…well, truly not much financially (since markets were basically flat last quarter), but we gained from may other perspectives; confidence in our indicators, no head-faking with excessive trading in an up-down market that proved to be FLAT, and, I think the big win is Wall Street not gaining from us—no commissions, no losses, we didnt play the noise game!
As for markets going forward, headed toward year-end, I must say, with the healthy 1.5% correction on 10/2, indicators aren’t rosey. However, true to the above, the indicators aren’t calling for anything just yet, so alas, we will remain disciplined. Some more perspective for you; we are a mere 3% off of ALL TIME MARKET HIGHS with 10/2’s sell-off. AND, re-visit the asset line up above; Domestic Equities and International Equities are in the #1 and #2 spots on the asset scale—this is as Bullish a line-up as we can get—so, any correction we have coming our way is NOT a 2008 or the line-up would be the exact opposite as it currently is.
Contrast the below 2008 Asset Class Line-Up to the current line-up, above (January, 2008 line-up–remembering that the sell-off in 2008 was in SEPTEMBER, a whole 9 later: THE LINE-UP GUIDES US EARLY TO MAJOR CORRECTIONS):
- Commodity
- Cash
- Foreign Currency
- Fixed Income
- Domestic Equity
- International Equity
The 2008 and current line-ups, again, are the exact opposites of one another. Most asset managers these days are selling gloom and doom as this is how they gather assets, spreading fear amongst investors in search of a better way. The landscape is indeed tricky at the moment, but in no way a doom and gloom situation. This market does and will require discipline to the Liberated Investor Model(TM) while shunning the lazy Buy and Hold approach that, in fact, earned investors almost 30% in 2013. It will also require discipline to data and our indicators versus buying or selling into the noise of Wall Street convincing us that actions surrounding what our ‘gut” tells us is actually, effective action. Remain confident in our strategic, data driven. logical approach and know that when indicators call for us taking some off of the table, I will be more than glad to do so—in the meantime, remember, we’ve got you managed!
My challenge continues: to ensure that 100% of our clients GET our “asset class line-up” philosophy. Let us know how we are doing! If you have any questions about the particulars of your portfolio, or would like to discuss the potential opportunities that I have seen arise within the equity markets, please click here to email me and let’s connect!
As we journey into 70%+ territory, just remember: We have you MANAGED! Did you find this too technical? Let me know what you want to hear about next Qtr!
Q3 2014 and YTD Market Stats:
06/30/2014 – 09/30/2014
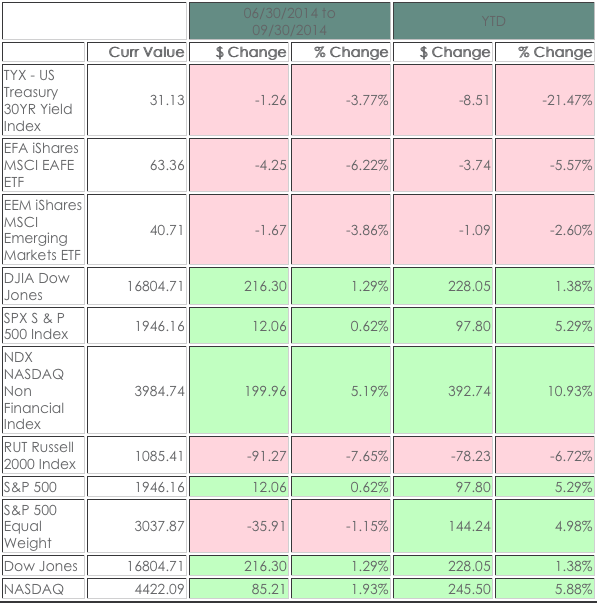
The returns for Indicies, ETFs and Stocks do not reflect dividends and are based on the last sale for the date requested
An interesting commentary from our partners at Dorsey Wright and Associates regarding the “80-60-40 Rule.” While credible in its track record, this “Rule” doesnt translate anywhere into our “rule book” it simply validates our indicators and offers confidence around our discipline to them, especially in markets like today.
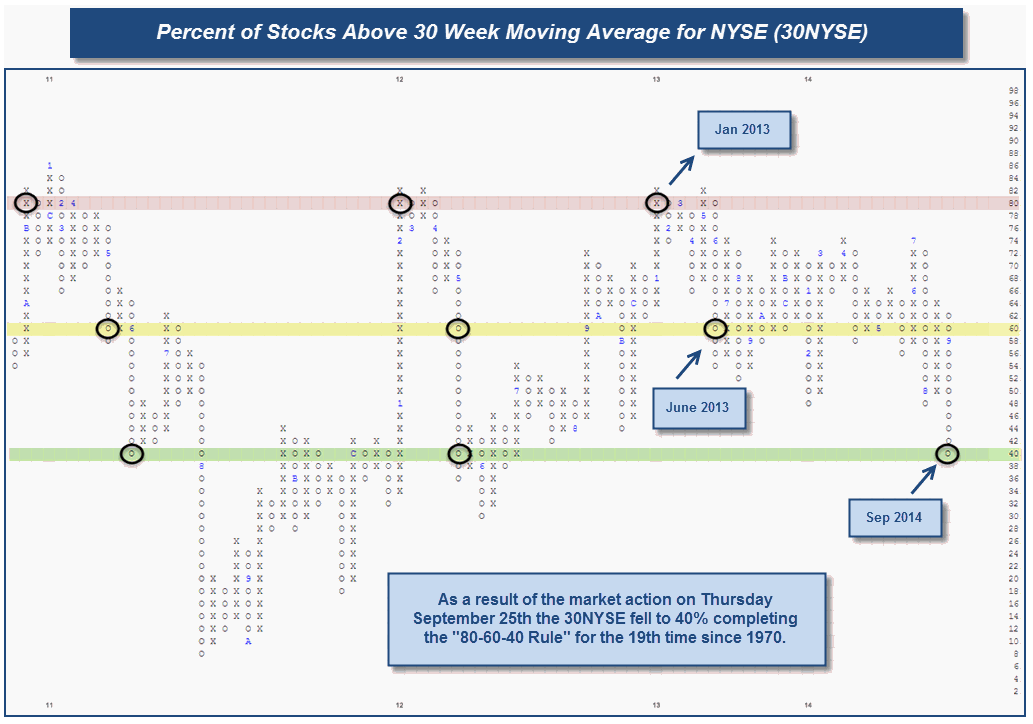
On Thursday, September 25th, the market saw the S&P 500 down more than 30 points and the Dow Jones Industrial Average [DJIA] was off 264 points. This was the first day since July 31st where the market averages fell by 1% or more, and just the 11th time all year (out of 185 trading days) the S&P 500 has fallen 1% or more. And while there as quite a bit of red on the quote screen today, we are most interested in how the market action has impacted our technical indicators. With that said, we wanted to bring to your attention one indicator in particular, and over the course of the next couple days we will discuss other areas impacted by recent market activity.
With the market action on Thursday, one indicator that we have been keeping a close eye on for more than a year now has finally completed the infamous “80-60-40 Rule”, and that indicator, as many of you are aware is the NYSE Percent of Stocks Above Their 30 Week Moving Average [30NYSE]. The 30 Week is basically a 150-day moving average, 30 weeks at 5 days a week, and the 30NYSE itself measures the percent of stocks that are trading above their respective 150 day MA. In looking more closely at the 30NYSE, it reached a high level of 82% in January 2013, then fluctuated between February and April, as it produced a lower top in March at 80%, when it pulled back and broke a bottom at 72% in April. After the May rally, 30NYSE managed to reverse back up into X’s, causing it to move back above the 80% level. However, by June 2013 the 30NYSE slipped to 58%, breaching the 60% level. We bring this to your attention because of a particular phenomenon associated with it hitting 60% after having reached 80% (or higher). It was Dan Sullivan of the Chartist that found when the Percent of 30 goes above 80% and then falls below 60%, it will see 40% before it sees 80% again. After reading about Dan’s insights years ago, we have since followed the 30NYSE closely for any developments along these lines.
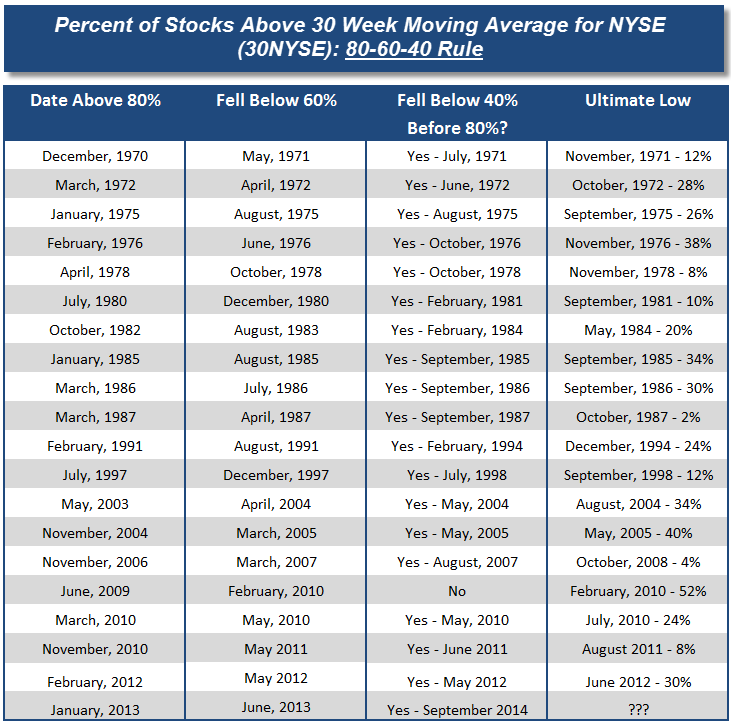
Out of the 19 times the 30NYSE has completed the “80-60-40 Rule” this is the second longest stretch between hitting 60% and eventually falling to 40% as it took 15 months from June 2013 until September 2014. The longest stretch on record was 30 months back in August 1991 to February 1994. So, yes, this was an abnormally long stretch of time from hitting 60% until falling to 40%. The question is, how long does it take until the 30NYSE ultimately bottoms out?
The average length of time has been 3 months for the 30NYSE to hit its ultimate low after hitting 40%. The longest stretch was in 2007 – 2008 when the 30NYSE fell to 40% in August 2007 and bottomed at 4% in October 2008, and in 1994 it took 10 months for the 30NYSE to hit its low at 24% in December 1994 after hitting 40% in February 1994. Interestingly enough, in seven out of the previous 19 instances, the 30NYSE bottomed in either the same month it hit 40% or just one month later.
SOURCE: DORSEY WRIGHT AND ASSOCIATES Thursday, September 25, 2014 DAILY EQUITY REPORT
Again, we use this information to validate what we are seeing in our indicators and to strengthen our discipline to our RULES. In doing so, we should steer effectively through the final shake-out of the 80-60-40 formation/pattern.
Resources, Resources, Resources!
Check out our new website and our Resources page on the Alphavest website and explore the many resources that we are trying to empower all investors with.
A snapshot of what’s there:
Morningstar™ Fee Analysis. Learn just how much you pay each year in fees and help others to educate themselves on what they pay too! Did you know that excessive fees can amount to upwards of 21% of your wealth over a 20-30 year period? We are committed to offering the lowest fees possible and want all of our clients to know what they are paying.
Free Consultations with Cokie. Not many use this function, but those who do have been pleased! We use this resource to offer investors an no-pressure opportunity to assess good-fit with Alphavest. This is a great place to send those that you think may need our services. Thank you for your referrals and consideration!
FINRA Advisor Background check. FINRA reports that only only a small percentage of investors check their advisors record before making a switch. We run background checks on our employees, our childcare providers—why not run one–its FREE–on the person who manages your money? Rest assured our record is spotless…here’s a copy of ours: Cokie’s U4. (How do we attach a PDF here?) The important feature of the report is that it will report “NO DISCLOSURES” which means no fraud or investor complaints.
Rules Quarterly
Some ask, “What makes Alphavest’s investment philosophy so different?” Or, “If you were to offer 1 thing investors should do to succeed….” and the answer is RULES.
I want to demystify the noise for investors and and help them break free from Wall Street’s games. One way to do this, beyond lowering fees and eliminating conflicts of interest is to abide by a rule-based, not an emotion or ego based investment methodology.
At Alphavest, that’s what we do: FOLLOW THE RULES.
Last Quarter’s Rule in review:
Rule: This rule is an expansion of the above commentary about our “Play Book” when the NYSE Bullish Percent is over 70%.
IF: NYSE Bullish Percent is over 70% and we are on Offense,
THEN: Move towards ETF (Exchange Traded Fund) ownership versus owning single stock names.
So, while currently Healthcare and Industrials are top of our list, we will be looking to own RYH (Healthcare ETF that owns 52 stocks) with a 2% position in Celgene versus buying a 5-10% position in Celgene, outright—much different risk scenario.
Click here to review the Q3 2014 overview.
New Rule to digest:
Rule: Honor proprietary rankings of all stocks and ETFs owned of 1-5.
IF: A stock or ETF falls below a ranking of 3…
THEN: SELL.
This rule is particularly helpful in weeding out the weaker players, in markets like we currently find ourselves. Owning securities ranked 3, 4 and 5 ensure that you own quality leaders, that, may correct along with markets, but will usually be among the first of your investments to recover the quickest.
Conversely, owning investments wtih rankings of 1 or 2, typically means that these investments are being outperformed by either their peers, the market or BOTH. AND, its these securities that will typically sell-off the most in uncertain markets such as these.
Stay tuned for more Rules next quarter.
Subscribe to Cokie’s Blog for more frequent updates on Markets and Matters….
Most of my blogs are less than 200 words – short and sweet! I have 2 weekly posts one is uber-short and the other highlights our Investment Management “Rules” with one Rule detailed each week.
Q3 Most Read Blogs:
- MARKET ALERT: August 8, 2014
- 4 Things About Stock Market Timing Signals You Didn’t Know
- Forget That Defined Income Variable Annuity: 3 Reasons Why You No Longer Need It
Join the Liberated Investor Movement TODAY!
We launched the Liberated Investor Movement in an effort to educate investors on how to break free from being held hostage by “Big Brokerage.”
The Liberated Investor Tool Kit exposes five areas of the investment management industry where the deck is stacked against investors and offers simple and direct advice:
- Excessive Fees and What Can Be Done About Them
- The Myth of Buy and Hold
- The Emotion Behind Market Timing
- Industry Conflicts of Interest
- How to Hire An Advisor That’s On Your Side
Download the Tool Kit today and share with your Facebook community and friends and family!
The best way to refer us? Tell others to download the FREE The Liberated Investor Tool Kit: