I’m a heart divided as I prepare to route for the Carolina Panthers in Super Bowl 50 while John Denver’s “Rocky Mountain High” sirens to me my many years living in Colorado. To make things worse, I’m a head divided as I wade through the precarious spot I, as an asset manager, find myself managing market indicators that are signaling market opportunity and market meltdown all at the same time.
In an effort to balance time in front of the idiot box today, I felt it fitting to baptize readers with a dose of market data, from our friends at Dorsey Wright. No noise, but data on the mother load of all indicators, pre-dating the Super Bowl at 60 years and counting, the New York Stock Exchange Bullish Percent (NYSE BP). Skip to bottom graphic for those wanting the short version of current market pros and cons….
This excerpt is from our data partner, Dorsey Wright and Associates’ Daily Equity Report 2/5/2016:
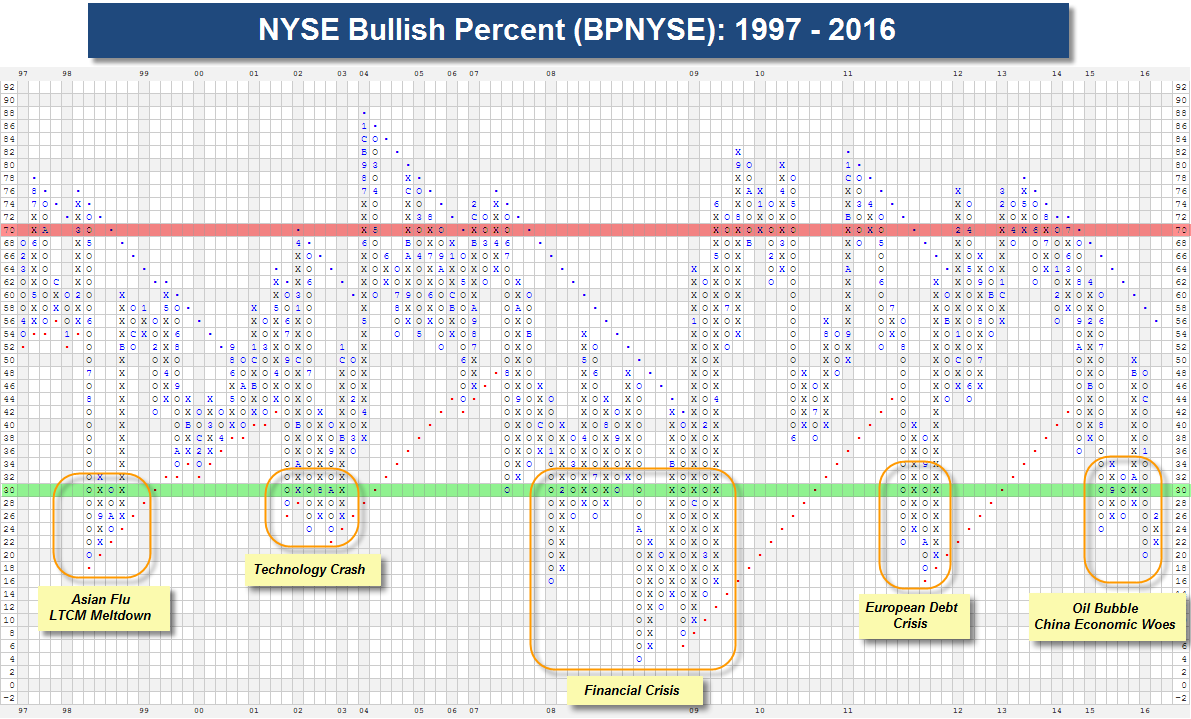
The concept is simple: it measures the percent of stocks that are bullish (with “bullish” defined as being on a Point & Figure buy signal). As more and more stocks give buy signals, the Bullish Percent reading rises in a column of Xs on the chart. Such an environment signals to an offensive posture for equity positions, with a focus on wealth accumulation. As stocks fall and give new PnF sell signals (thus giving up their buy signals), the BP reading declines (denoted in Os on the chart). At these times, equity positions should be handled more defensively, with greater importance placed on wealth preservation. In addition to the column (X = offense, O = defense), there are also two major areas of demarcation for this indicator. Any time the chart moves above 70%, we are operating in the “red zone” – suggesting elevated risk. A move below 30% puts us in the “green zone” and risk is considered to be relatively low, as those that want to sell have already sold. Together, the column and the field position allow us to use this indicator both as a representation of stock participation and risk in the broad equity market. As a result, it is the column changes, or turning points, that occur at the “extremes” that really attract our attention. Specifically, reversals from Xs to Os that occur above 70% are notable, as such a change triggers defense in the red zone — where stakes are high. Reversals from Os to Xs from below 30% provide the opposite scenario – a move to offense in the green zone, meaning minimized risk from oversold conditions.
Earlier this week, we witnessed one of these turning points at an extreme level. As a result of Monday’s action, the BPNYSE went from Os to Xs from a recent low reading of 20%. Looking at the indicator’s history below, we find that there have only been a handful of periods where this type of scenario presents itself; and each was during a notable time in the markets. Today, we wanted to review how these scenarios played out in the past, and also discuss what the current reversal to Xs may mean for your portfolio strategies.
Looking back over the last 20 years, we can easily identify four previous time frames in which the BPNYSE as fallen in to the green zone, below the 30% level.
- 1998 – As the “Asian Flu” spread to US markets, the BPNYSE had fallen to 20% by August 1998. The initial reversal occurred in September, and took the indicator up to a reading of 32%. There was a “retest” as the indicator returned to Os that was ultimately resolved with a higher bottom at 24%. By early November the BPNYSE had rallied to 60% as demand quickly returned to equities.
- 2001-2002 – The tech bubble reached a peak in early 2000, and by 2001 the effects of the burst were being felt across the market. The column of Os that began in June of 2001, was hastened by the terrorist attacks of 9/11, and it fell below 30% later in the month. From October 2001 through April of 2002, the BP rallied nicely and higher prices were achieved across the major market indexes; but by the Summer of 2002, the indicator found itself back in the green zone at 24%. A lower top was made in August, followed by a retest at 24% in October of 2002, just as the Nasdaq Composite found a bottom. The reversal back in to Xs in mid-October, ultimately led to bull confirmed status (a buy signal) on the BPNYSE by November. Participation continued to expand throughout the equity landscape in to early 2004, when the BP chart found a peak at 86%.
- 2008-2009 – This was a frustrating time for the Bullish Percent indicator as the unruly volatility led to an oscillating pattern on the chart. In fact, the chart moved below and back above the 30% level a total of 4 times from January through November of 2008. A few retests of previous lows were made during this time, some managing higher bottoms and some falling further than previous lows. It was also during this period that the BPNYSE hit a new all time low at 4% in October of 2008. It wasn’t until March of 2009 that the S&P 500 found a bottom, but participation began to increase in late 2008. By December the indicator had moved back to bull confirmed status, and maintained that status for the next 14 months.
- 2011 – The BPNYSE found a high in January 2011 at 80%, but spent the remainder of the year making lower tops and lower lows. A bearish pattern like this on an indicator chart tells us that leadership is narrowing and that fewer and fewer stocks are able to participate in bounces. The initial move below 30% happen in August of 2011, shortly after US debt ratings were downgraded for the first time. An initial reversal followed later in the month, but as the European Debt Crisis came to a head, selling pressure became even more widespread and the bullish percent reading fell to 18% in early October.
The reversals up from below 30% do not occur often, and as you’ve read above, they also do not resolve themselves in a similar manner each time. In some instances, like August-October of 1998, the resolution is quick, straightforward, and to the upside. During times of increased volatility (which causes back and forth action on individual charts), like we had in 2008, there may be a few “fake outs” before follow through to the upside is sustainable. We have no way to know whether or not this reversal will behave more like a 1998 or a 2008. The most likely scenario is that it will look like “a 2016”, meaning it will be slightly different than any of the occurrences before it.
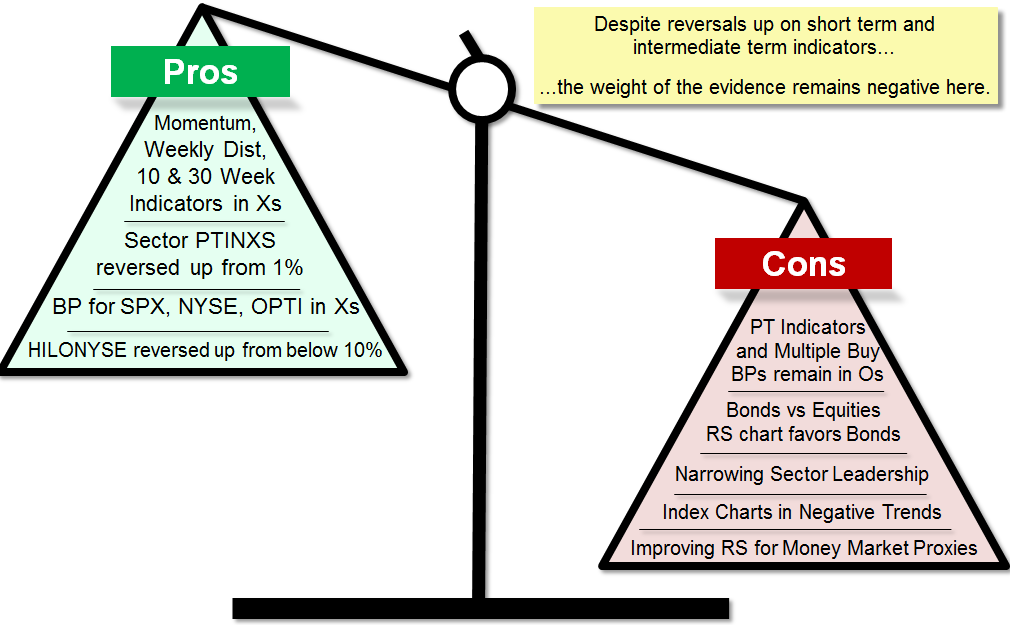
So, the question remains, “What does the reversal up mean?” Perhaps this question is best addressed by first discussing what it does not mean. The reversal up from below 30% on the BPNYSE does not mean we have found a bottom in the market. It does not mean it’s time to “bet the farm.” It does not mean we can’t move lower. For now, the reversal does mean that we have seen more than 6% of stocks on the NYSE return to Point & Figure buy signals (approximately 8% as of Friday). It means that net new demand is returning to the marketplace on an individual stock basis. It means that the offensive team is back on the field, and we can begin to deploy cash in to high RS names with positive trending characteristics. However, as is always the case, we still want to be mindful of the overall weight of the evidence. The BPNYSE is just one of many indicators that contributes to our general outlook for equities. The image below serves to separate the pros from the cons in terms of the changes we are observing in the current market environment. As you can see, despite reversals up on the short term and intermediate term indicators, the weight of the evidence remains on the negative side for now.
So, today it’s “Go Panthers” and when trading resumes tomorrow, while we still have our toe in equity waters, and despite the reversal up of most of the short and medium term indicators, our Cash and Bond positions will remain quite high. Back to the TV; we’ve got you managed.