Quiet the Noise (Listen to the Data)
Below you will find a “temperature reading” on the market and the risk level on the “field.”
Relative Strength Line Up of the Asset Classes:
Q1 2015 Update: Fixed Income takes #2 spot from International Equities and Cash overtakes Currency at #4
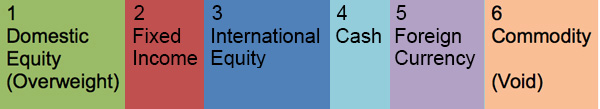
1/1/2015:
- #1 Asset Class: Domestic Equities
- #2 Asset Class: Bonds/Fixed Income
- Market Status: BULL
- NYSE Bullish Percent: 54.17% (UP from 53.06% Q4, virtually unchanged) OFFENSE (Reversed UP from Defense on 10/29/14 @ 43.11%)
2014 Overview and What 2015 Holds
2014 was the year for buying and holding Large-Cap/S&P 500 holdings. Those who diversified and held otherwise will see single digit returns in 2014. Specifically, international and energy holdings were the largest culprits of portfolio “drag” in 2014.
While international holdings did hold back our overall returns (visa vie the “broken” yardstick of the S&P 500—ahem, more to come!), we must thank this segment of the market for outperformance in 2013 and some of 2014. Nontheless, as you see above, International Equities fell to the #3 spot on the Asset Scale which means that your portfolios now own very little International stocks and ETFs. With Bonds now in the #2 spot, even our most aggressive allocations will see some exposure to bonds/fixed income at this time.
Does this mean that its time to worry about 2015? I don’t think so, but facts are facts. An asset class line up with both equity asset classes (Domestic Equity and International Equity) in the #1 and #2 spot is, well, more optimum for double-digit-type Bull Market returns. And that line-up just isn’t so anymore. Keep in mind that Bonds and International are neck-and-neck for the #2 spot, so it could very well come to pass that my next Alert distribution announces just that, that International is back in the #2 spot—so lets take the indicators as they are, and not make too much of them, today, since there is very little leadership amongst the #2 and #3 spots.
However, there continues to be clear leadership from Domestic Equities in the #1 spot—well out in the lead by a large margin over that of the aforementioned #2 and #3 placeholders. This means we are still overweight in domestic or US stocks and ETFs across all portfolios.
My challenge continues: to ensure that 100% of our clients GET our “asset class line-up” philosophy. Let us know how we are doing! If you have any questions about the particulars of your portfolio, or would like to discuss the potential opportunities that I have seen arise within the equity markets, please click here to email me and let’s connect!
We have you MANAGED! Did you find this too technical? Let me know what you want to hear about next Qtr!
Q4 2014 and 2014 Year-end Market Stats
Excel Spreadsheet
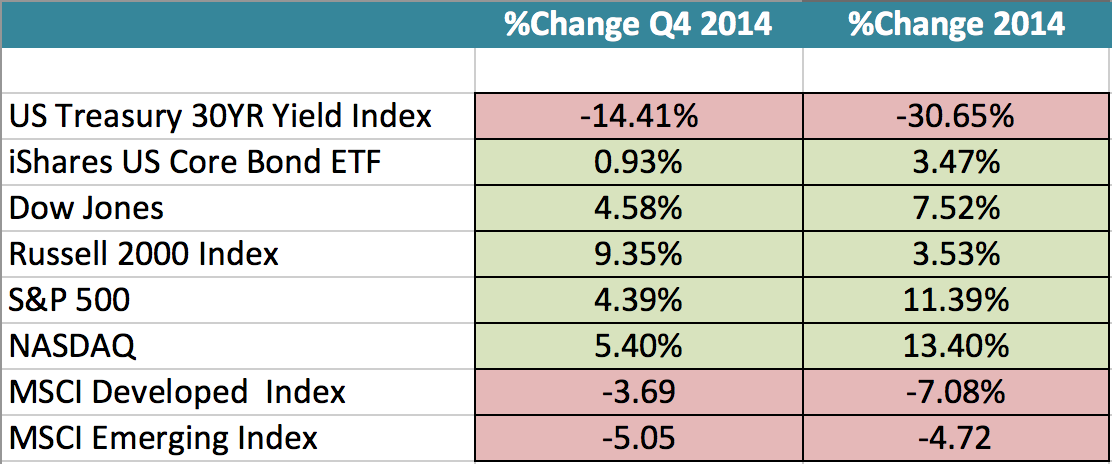
The returns for indexes, ETFs, futures, and stocks do not reflect dividends and are based on the last sale for the date requested. Returns for mutual funds do account for distributions. Performance data does not include all transaction costs. Past performance is not indicative of future results. Potential for profits is accompanied by possibility of loss.
Alphavest Models:
Alpha ManageIt! Core Models:
- AV200: 8.89%
- AV100: 8.05%
- AV60: 5.92%
- AV30: 4.16%
- Analysts: 13.44%
- Buffett: 14.38%
- Defensive: 17.92%
- Dividend: 2.32%
- Dogs: 11.08%
- Globe: 18.73%
- Healthcare: 23.42%
- Ivy League: -.16%
- Long/Short: 9.41%
- REIT: 29.83%
- SPYDIV: 17.95% (partial year 7/31/14-12/31/14)
The Broken Yard Stick
All who invest with Alphavest do so becuase they belive in an investment methodology that brings rules, data and logic; a Relative Strength methodology. It is this methodology that will steer us around the meaningful bumps, but may not offer returns that look like the previously mentioned “broken yardstick” of the S&P 500.
Why is the S&P 500 a “broken yardstick” for performance? Would you have wanted the S&P 500 as your yardstick in not just 2008 (-38%), but in the 3rd quarter of 2008 (-30%), alone? NOPE. Picking and choosing a benchmark based upon a basket of 500 large company stocks seems a bit silly when all we hear and preach is diversify, diversify, diverisfy, right?
Our “yardstick,” and not without controversy, I will add, is a Global Long/Short index that mimics a diversified global portfolio. The Credit Suisse Long/Short Index that we use is a diversified basket of broad asset classes (ahem), not limited to only large US companies, like the S&P 500. The Credit Suisse Long/Short Index also incorporates cash investments as well as the ability to short stocks in poor equity markets. If this type of index, one that is diversified, can buy cash and sell stocks in poor markets sounds like a prudent way to invest, then, we agree, the Credit Suisse Long/Short Index should be your yardstick—and for us at Alphavest, indeed it is.
We like giving the consumer what they want, right, wrong or otherwise—so our portfolios are up for the S&P 500 challenge. On a long-term basis our goal for all equitiy clients, and we have the track record to prove it, is and does beat the S&P 500. In the meanwhile, invest on and quiet the noise!
2015 Investment Outlook: The Good, the Bad and the Not-So-Ugly
Predictions beyond a quarter or two aren’t based on much data or fact, so let’s agree to take this to mid-2015, shall we? You’ll not get from me where the DOW or NASDAQ will finish in 2015.
You see, prognosticating is what the consumer wants — investors, that is. So while we’ll give what you want, data and facts are what we’ll use to offer a vision for the future, rather than subjective, gut feelings that analysts or economists may use in formulating their 2015 predictions.
It’s always fun to look back at the predictions and see who got what right and who got what wrong. I’d say on the whole, the top economists’ forecasts did get a lot right for 2014. Most were predicting healthy growth, tame inflation, low interest rates, rising stock prices, and declining unemployment — and that’s just what we got.
So, what did I predict last year? It won’t surprise you to re-read that it wasn’t an earth-shattering insiders view of edgy prognostication, but I was right:
One of the major themes that is in place at the start of 2014 is the leadership of Domestic Equity, or “stocks.” Out of the six broad asset classes that I track, Domestic Equity remains the top ranked asset class, and that continues to be the case today. In other words, this continues to be a strong area of the market and one that I will continue to focus on. Additionally, nearly 75 percent of all stocks trading on the New York Stock Exchange are in a positive trend today, which is to say that the majority of stocks continue to show positive trends. I should note, also, that all of the major equity indices continue to trade in a positive trend, which is another positive sign for the market.
Indeed, Domestic Equities were the place to be in 2014 and the US markets were all positive and quite strong in 2014.
Here’s what we think the 2015 investment outlook looks like (drum roll, please…):
Status Quo through mid-2015.
This is when you hear that game show “whan, whan, whannn…” as the participant loses the game.
Sorry, folks — no drama, no sparks. No sell off, yet no fireworks seen in sight. Slow and steady wins the race, is what I see from the current data.
Why? Tune in for the Good, the Bad, and the Not-So-Ugly.
Resources, Resources, Resources!
Check out our new website and our Resources page on the Alphavest website and explore the many resources with which we are trying to empower all investors.
A snapshot of what’s there:
Morningstar™ Fee Analysis. Learn just how much you pay each year in fees and help others to educate themselves on what they pay too! Did you know that excessive fees can amount to upwards of 21% of your wealth over a 20-30 year period? We are committed to offering the lowest fees possible and want all of our clients to know what they are paying.
Free Consultations with Cokie. Not many use this function, but those who do have been pleased! We use this resource to offer investors an no-pressure opportunity to assess good-fit with Alphavest. This is a great place to send those that you think may need our services. Thank you for your referrals and consideration!
FINRA Advisor Background check. FINRA reports that only only a small percentage of investors check their advisors record before making a switch. We run background checks on our employees, our childcare providers—why not run one–its FREE–on the person who manages your money? Rest assured our record is spotless…here’s a copy of ours: Cokie’s U4. (How do we attach a PDF here?) The important feature of the report is that it will report “NO DISCLOSURES” which means no fraud or investor complaints.
Rules Quarterly
Some ask, “What makes Alphavest’s investment philosophy so different?” Or, “If you were to offer 1 thing investors should do to succeed….” and the answer is RULES.
I want to demystify the noise for investors and and help them break free from Wall Street’s games. One way to do this, beyond lowering fees and eliminating conflicts of interest, is to abide by a rule-based, not an emotion or ego based, investment methodology.
At Alphavest, that’s what we do: FOLLOW THE RULES.
Last Quarter’s Rule in review:
Rule: Honor proprietary rankings of all stocks and ETFs owned of 1-5.
IF: A stock or ETF falls below a ranking of 3…
THEN: SELL.
This rule is particularly helpful in weeding out the weaker players, in markets like we currently find ourselves. Owning securities ranked 3, 4 and 5 ensure that you own quality leaders, that, may correct along with markets, but will usually be among the first of your investments to recover the quickest.
Conversely, owning investments wtih rankings of 1 or 2, typically means that these investments are being outperformed by either their peers, the market or BOTH. AND, its these securities that will typically sell-off the most in uncertain markets such as these.
Click here to review the Q4 2014 overview.
New Rule to digest:
NO matter what your risk tolerance, IE 100% equity/full risk investor, honor the Asset Scale by overweighting your portfolio in the top #1 and #2 ranked asset classes, and forget about the rest.
For example, NOW, Bonds or Fixed income are ranked #2 on the Asset Scale. Just becuase you may be 30 years old and a risk taker, doesn’t mean you need to own poorly performing assets in your portfolio. You need to own some bonds, for now.
The stale and outdated Modern Portfolio Theory (MPT) pie chart would tell a 30-45 year old risk taker to own 20% International holdings and 5-10% commodities ALL THE TIME. WHY do that when they are underperforming? Own what’s performing.
Just because bonds don’t sound “sexy’ doesnt mean you should dabble there since they are proving themselves in the way of performance visa vie that of their other asset counterparts; commodities, international, currency and cash.
Subscribe to Cokie’s Blog for more frequent updates on Markets and Matters….
Most of my blogs are less than 200 words – short and sweet! I have 2 weekly posts one is uber-short and the other highlights our Investment Management “Rules” with one Rule detailed each week.
Q4 Most Read Blogs:
- What You Should Know About Investment Management Fees
- How to Check Your Financial Advisor’s Background (and What Red Flags to Avoid)
- Beware: It’s Capital Gains Tax Distribution Season
- The Ultimate Buy and Hold Strategy: Worst Advice You Could Ever Get?

Join the Liberated Investor Movement TODAY!
We launched the Liberated Investor Movement in an effort to educate investors on how to break free from being held hostage by “Big Brokerage.”
The Liberated Investor Tool Kit exposes five areas of the investment management industry where the deck is stacked against investors and offers simple and direct advice:
- Excessive Fees and What Can Be Done About Them
- The Myth of Buy and Hold
- The Emotion Behind Market Timing
- Industry Conflicts of Interest
- How to Hire An Advisor That’s On Your Side
Download the Tool Kit today and share with your Facebook community and friends and family!
The best way to refer us? Tell others to download the FREE The Liberated Investor Tool Kit: